Your Answer ▼
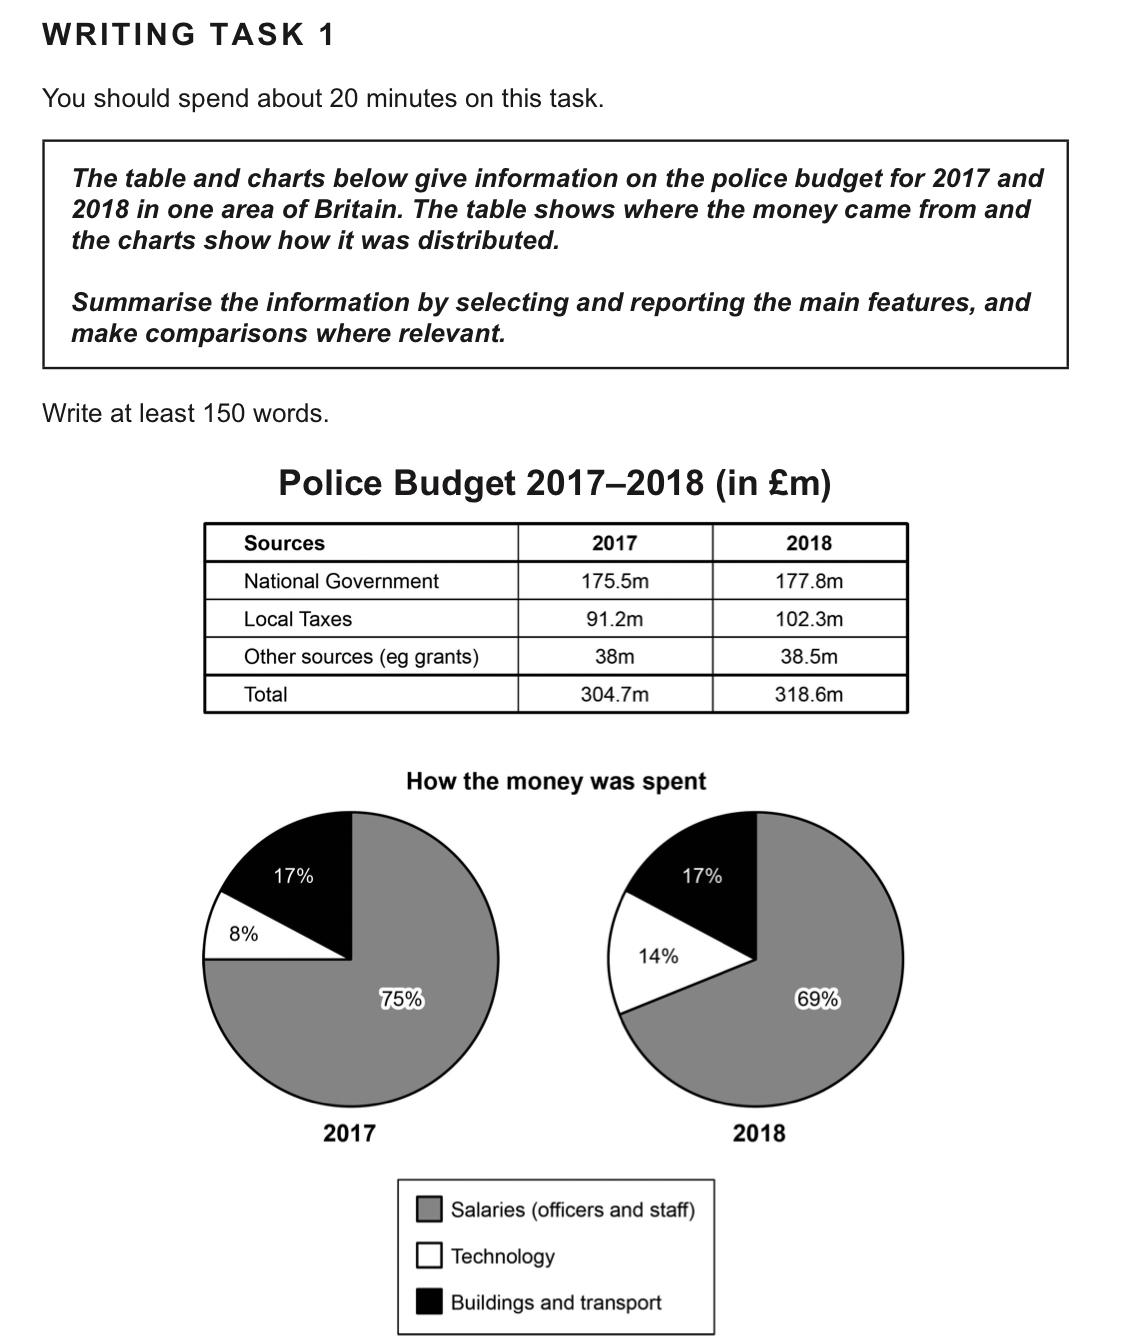
The first table shows the sources of the police budget in million pound units from a certain part of the UK between 2017 and 2018, and the second pie charts show how it used the budget.
Firstly, the table clearly shows that overall increasing trend was seen throughout the period regardless of the budget sources. It is noteworthy that the source of national goverment accounted for the highest portion of the budget over the period. This figure was over the half of the whole budgets in 2018 (177.8million pounds). In contrast, the other two sources (local taxes and other sources) only accounted for 140.8 million pounds in the budget during this time, which was smaller than the cost of the national goverment.
Secondly, In regard spending the budget, the police spend spent the most money on pay between 2017 and 2018. The salaries' cost of their officers and staffs accounted for almost three quaters of the budget over the period. On the other hand, the police used the lowest money by technology, and buildings and trastport sectors throughout this period. These figure of buildings and transports sector increased to an almost double(14%)of the money, but the figure of technology sector remained at 17% of the money in 2018, respectively.
Overall, It is seen that there was small changes in both source and distribution of the police budget between 2017 and 2018. The largest cost of budget source was recorded the national government while the highest cost of budget consumption was recorded the salaries throughout the period. | 


 인쇄
인쇄


 비밀번호 확인
 댓글 0개
댓글 0개


 불편사항 신고