Your Answer ▼
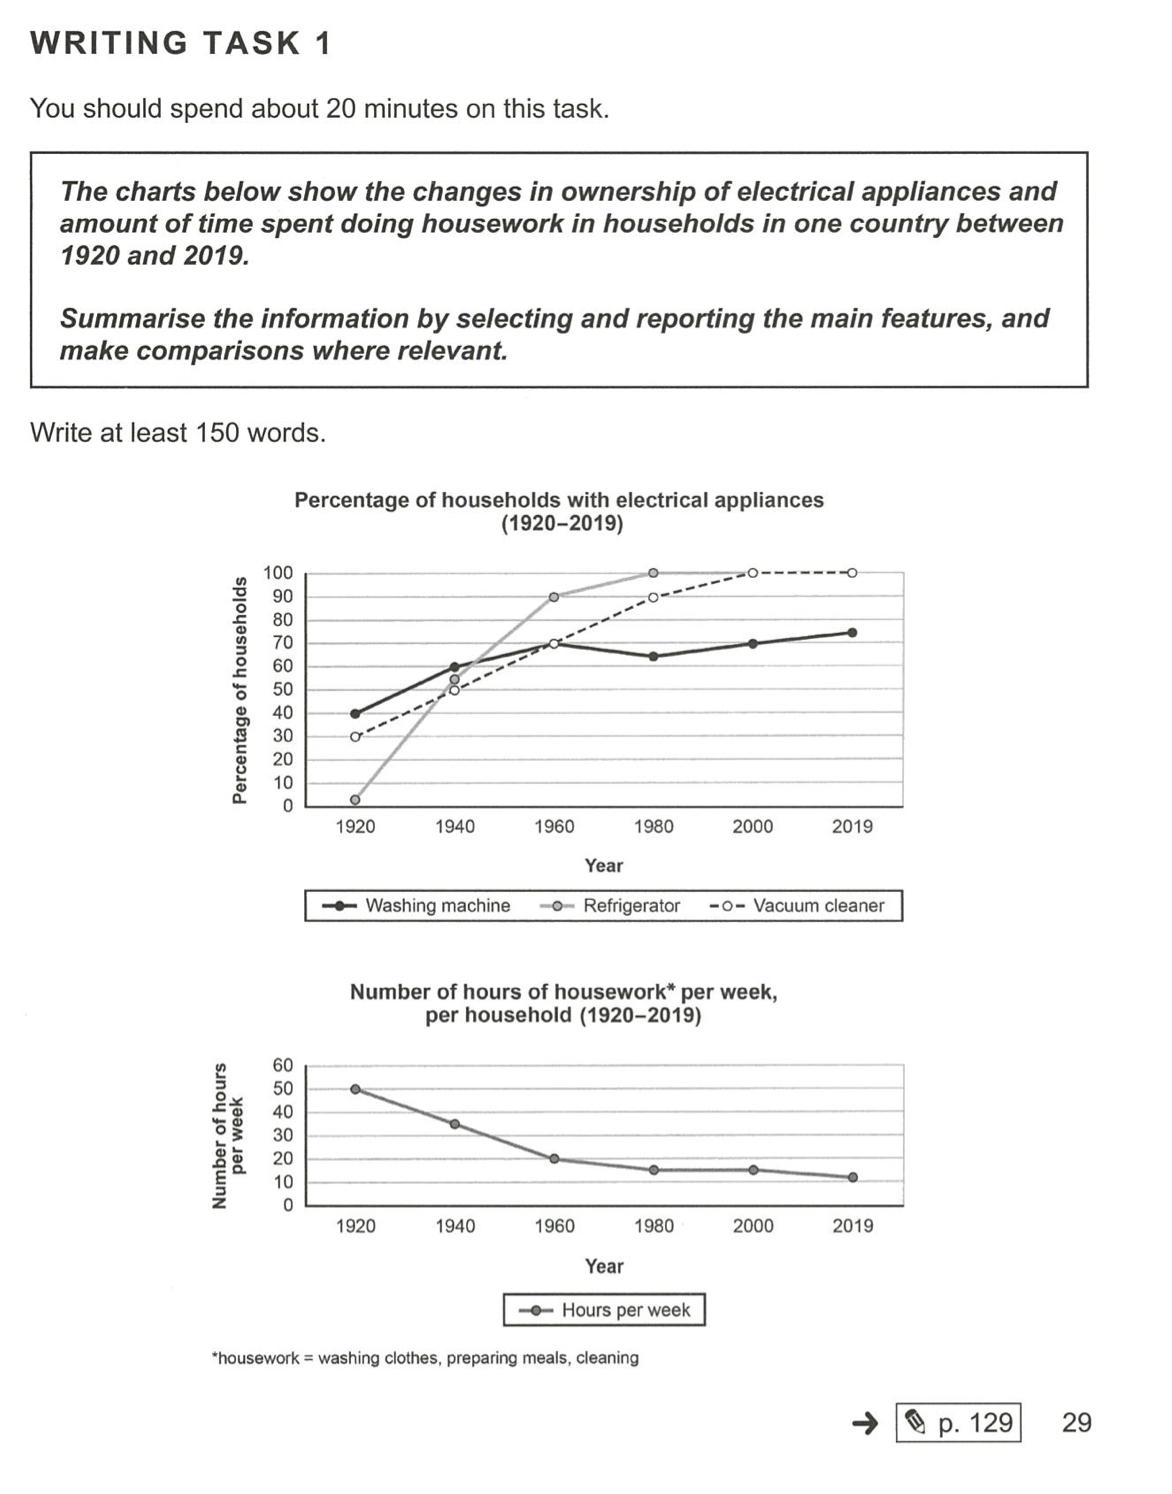
The first line graph illustrates the percentage of the ownership of three different household appliances in a particular country between in 1920 and in 2019, and the second graph illustrates the number of hours of the housework per week throughout the period.
According to the first chart, many families did not have the three household appliances in 1920. Only 30% of households owned vacuum clearners, and also 40% of households owned washing machines, while there was no house owned owning a refrigerator. However, many families came to own these three home appliances after this time. In particular, between 1920 and 1960, the percentage of ownership of refrigerator substantially increased to 90%, and the proportion of ownership of both washing machine and vacuum cleaner increased by about half (70%), respectively. After 1960, the all households had ownerships of the washing machines and refrigerators, except for vaccum cleaners (70% of household only owned it).
Moreover, the second chart clearly shows that all households spend a lot of time to do house chores at the beginning of the period. They did house chores about 50 hours per week during this time. Since then, the time to do housework gradually went down until 2019. The particularly notable was the period between 1920 and 1960, when the housework hours significnatly decreased to 20 hours per week in 1960. And then, there was little change in the hours of housework, showing an only 10 hours decrease per week over the 59 years.
Overall, many household gradually owned washing machines, refrigerators, and vacuum clearners more and more over the entired period and no longer spent more time doing housework than before. Also, Both of these changes were severe between 1920 and 1960, and then became relatively stable untill 2019.
|


 인쇄
인쇄


 비밀번호 확인
 댓글 0개
댓글 0개


 불편사항 신고