|
|
|
|
| ▶ Your Answer :
IELTS Writing 캠브릿지8권 Test2 Task1 / 140211 / 21분23초
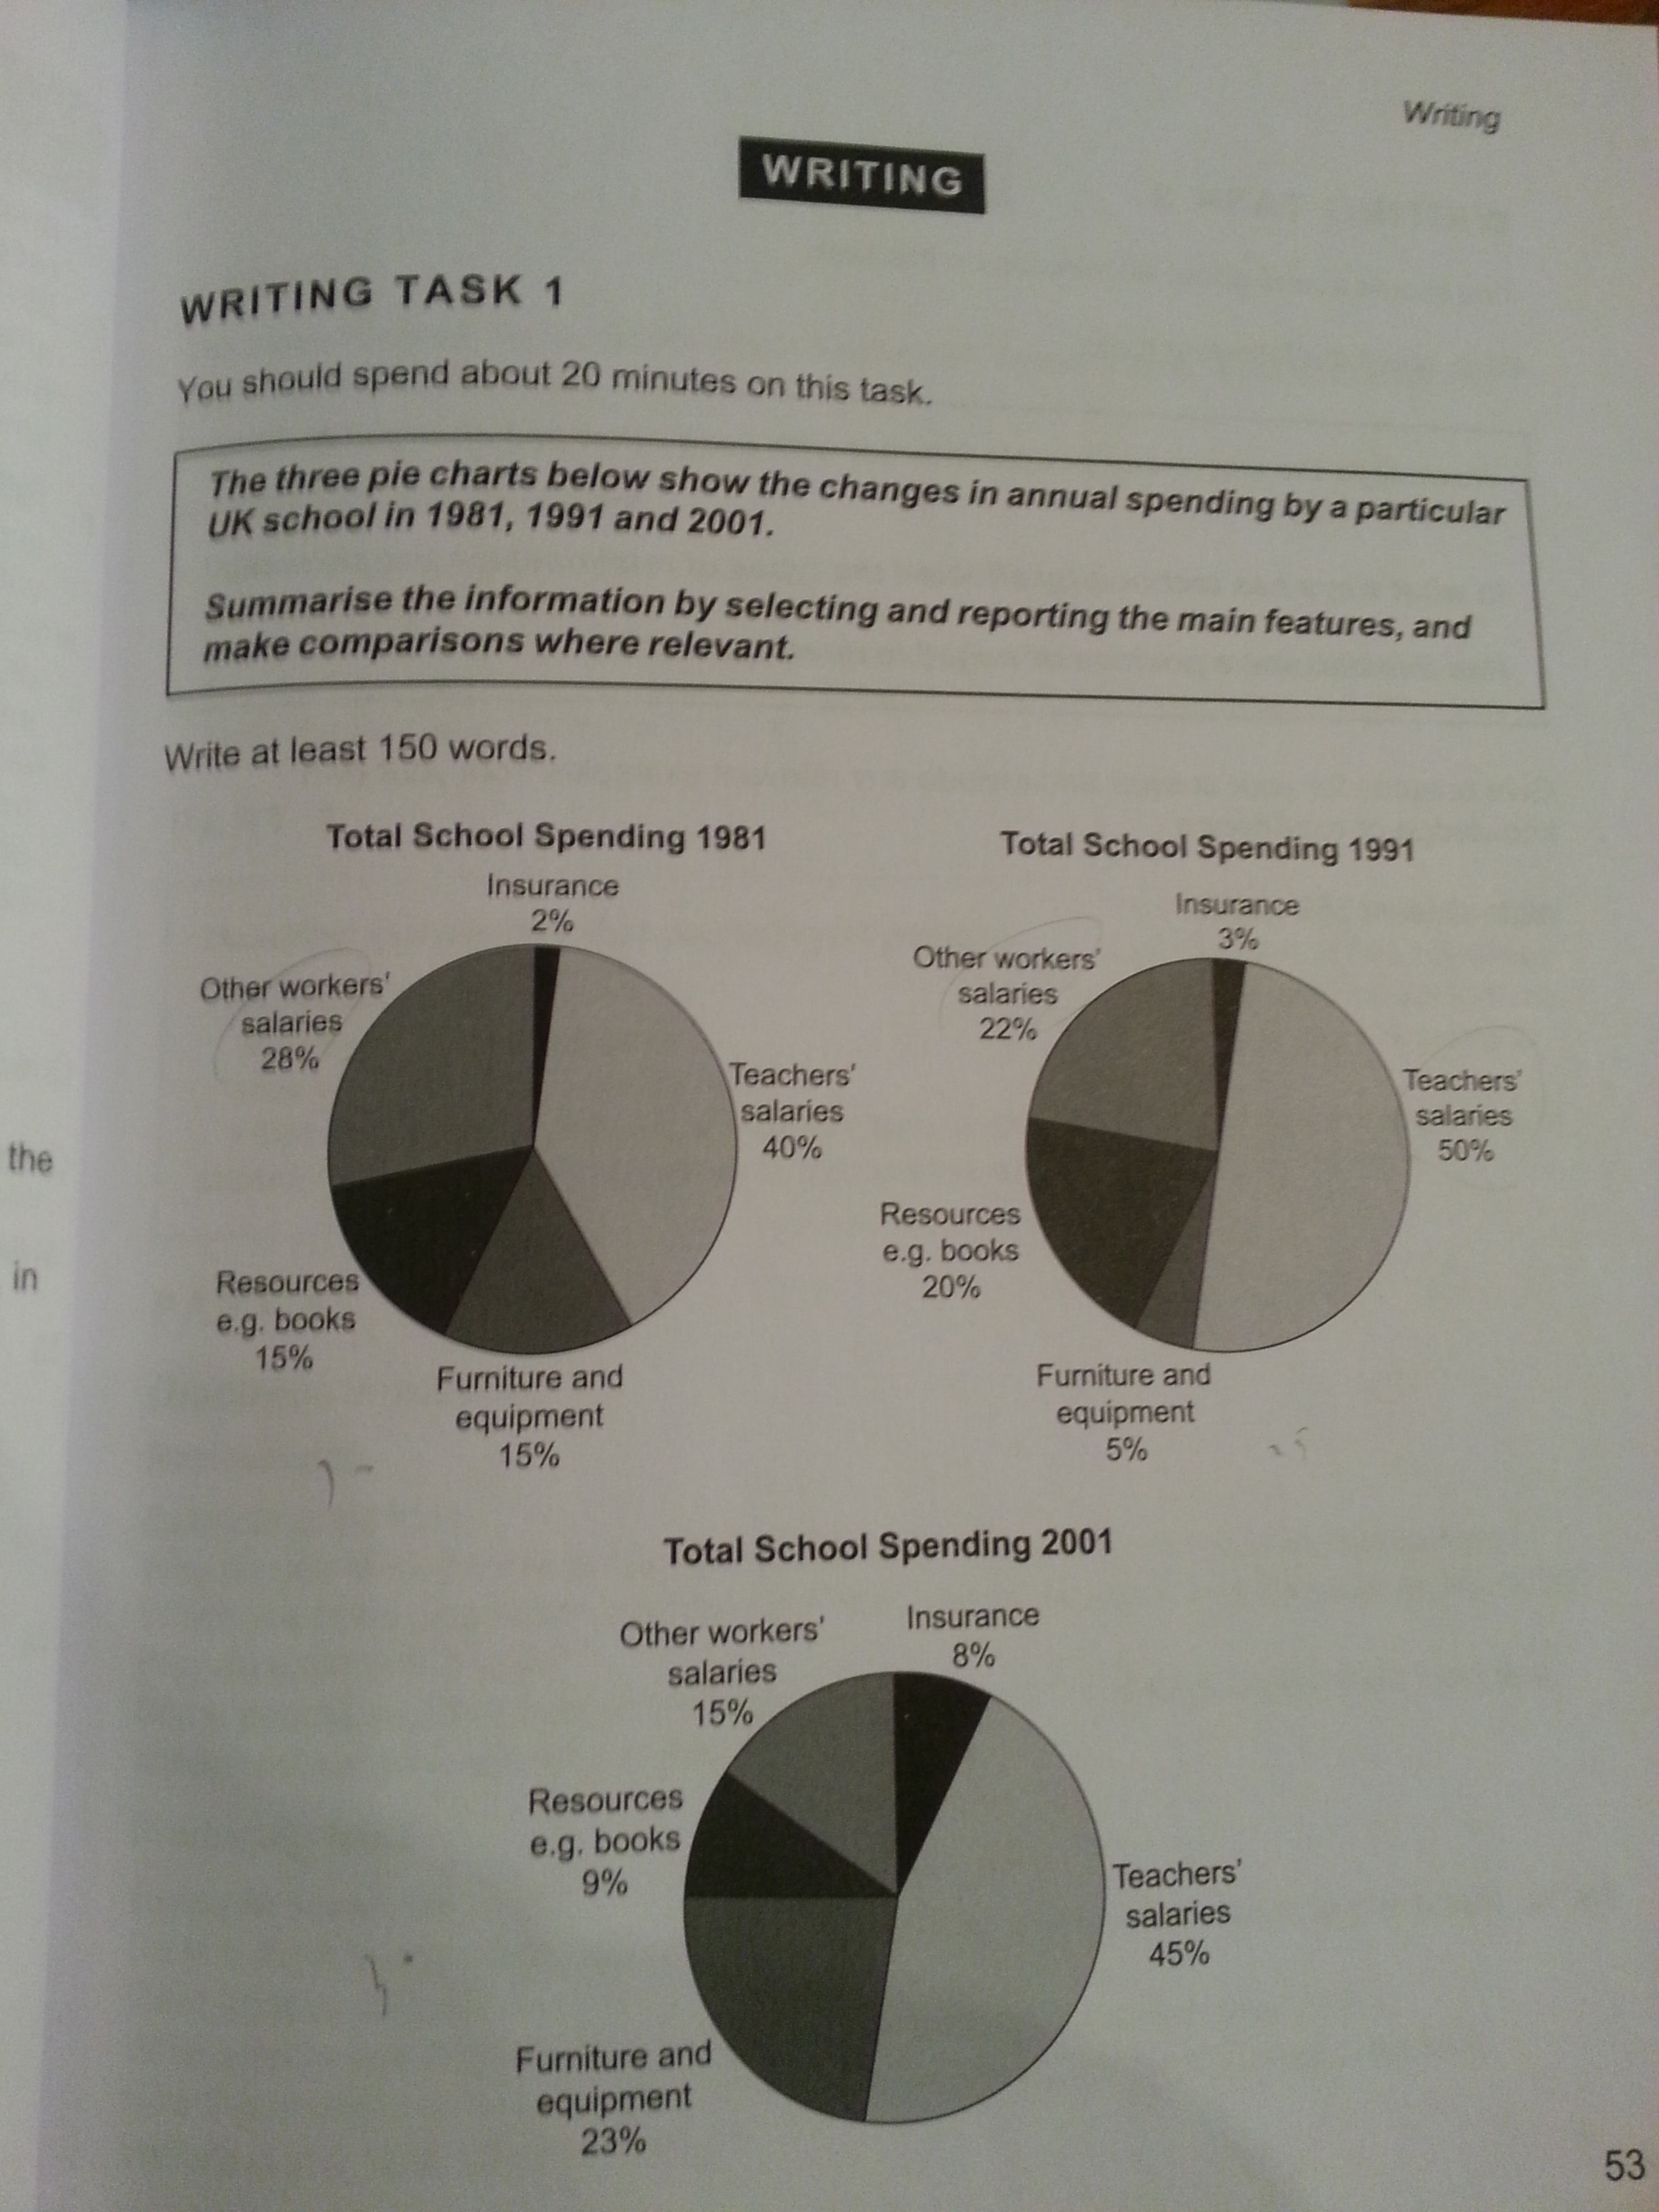
The figures illustrate that how the annual spending changed at particular school in the years 1982, 1991 and 2001.
Teacher’s salaries have the dominant proportion at all years. In 1981, it took 2 in 5 of total school spending. After peaking at the half proportion the following decade year, there was a slight decrease by 5%.
In contrast, other worker’s salaries show a gradual decrease during these decades, from 28% in 1981 to 15% in 2001. It was over the half of teacher’s in 1981, but 1 in 3 of them in 2001.
There were fluctuations on the other two factors, ‘Resources e.g. books’ and ‘Furniture and equipment’. Resources had some increase through first half of these years, from 15% to 20%. in that period however, furniture/equipment had a drastic fall from 15% to 5%. in contrast there were dramatically changes on them after 10 years. Resource showed 9% which is just below half of the 1991 figure, while the proportion to buy furniture and equipment recorded more than four times as likely as that in 1991.
Insurance proportion had a steadily increase, but it still remained relatively insignificant.
Overall, through two decades, there was a dramatic change on some parts, while teacher’s salaries remained the dominant proportion. | |
휴.. 혼자 너무 많이올려서 제이님뿐만아니라 게시판을 이용하시는 모든분들께 죄송합니다..ㅠ
모두들 열공하셔서 다들 원하는 결과 꼭 얻으시길...!!


 인쇄
인쇄


 댓글 0개
댓글 0개


 불편사항 신고
