


 인쇄
인쇄


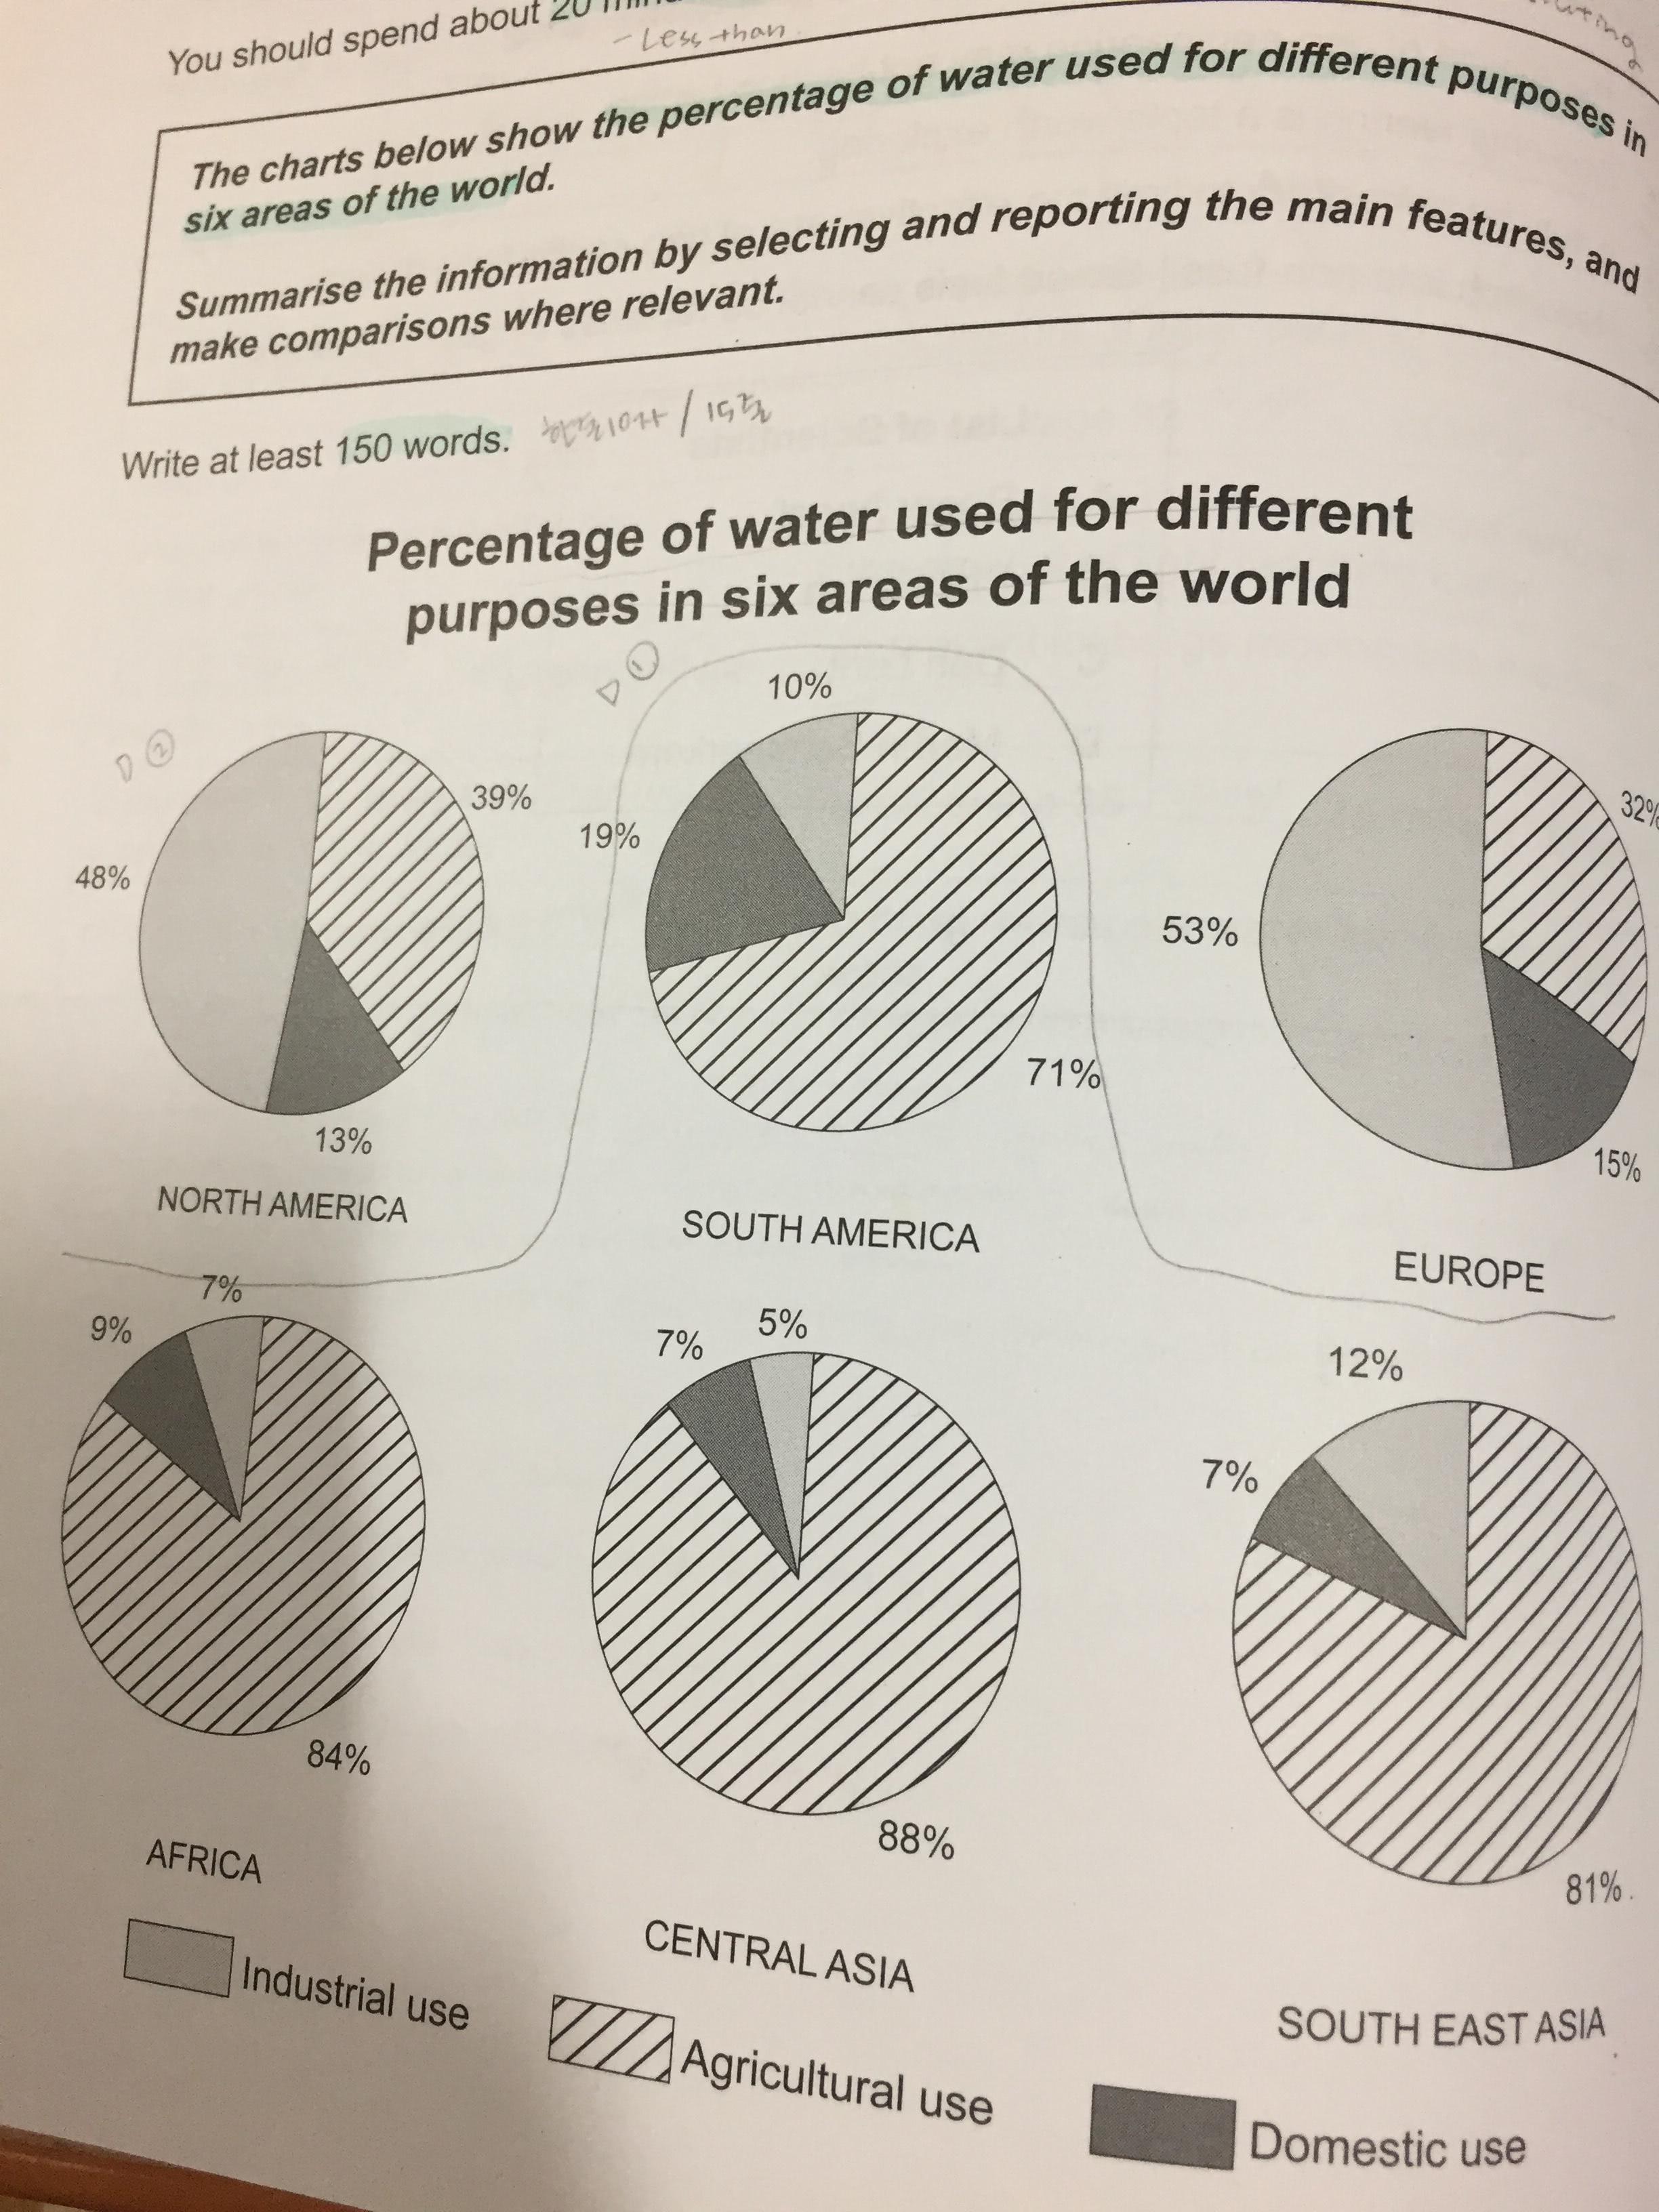
The pie charts depict the information about proportion of water consumption for industry, agriculture and domestics in North America, South America, Europe, Africa, Central Asia and South East Asia. South America, Africa, Central Asia and South East Asia consume water for agriculture and The proportion in North Ameirca and Europe represent about a half of industrial use.
Turning to the details, the proportion in South East Asia. South America, Africa, Central Asia and South East Asia dominate agricultural use, accounting for over 70%. The industrial and domestic consumption is marginal. The four countries for domestics constitute from 7% to 12%. The industrial consumption of four countries is at least 5% and at maximum 12%.
Meanwhile, North America and Europe use for industry, which takes up 48% and 53% respectively. This followed by agricultural consumption which is 39% and 32%. The proportion of domestic consumption is minimal, showing 13% and 15%.

 댓글 0개
댓글 0개


 불편사항 신고