


 인쇄
인쇄


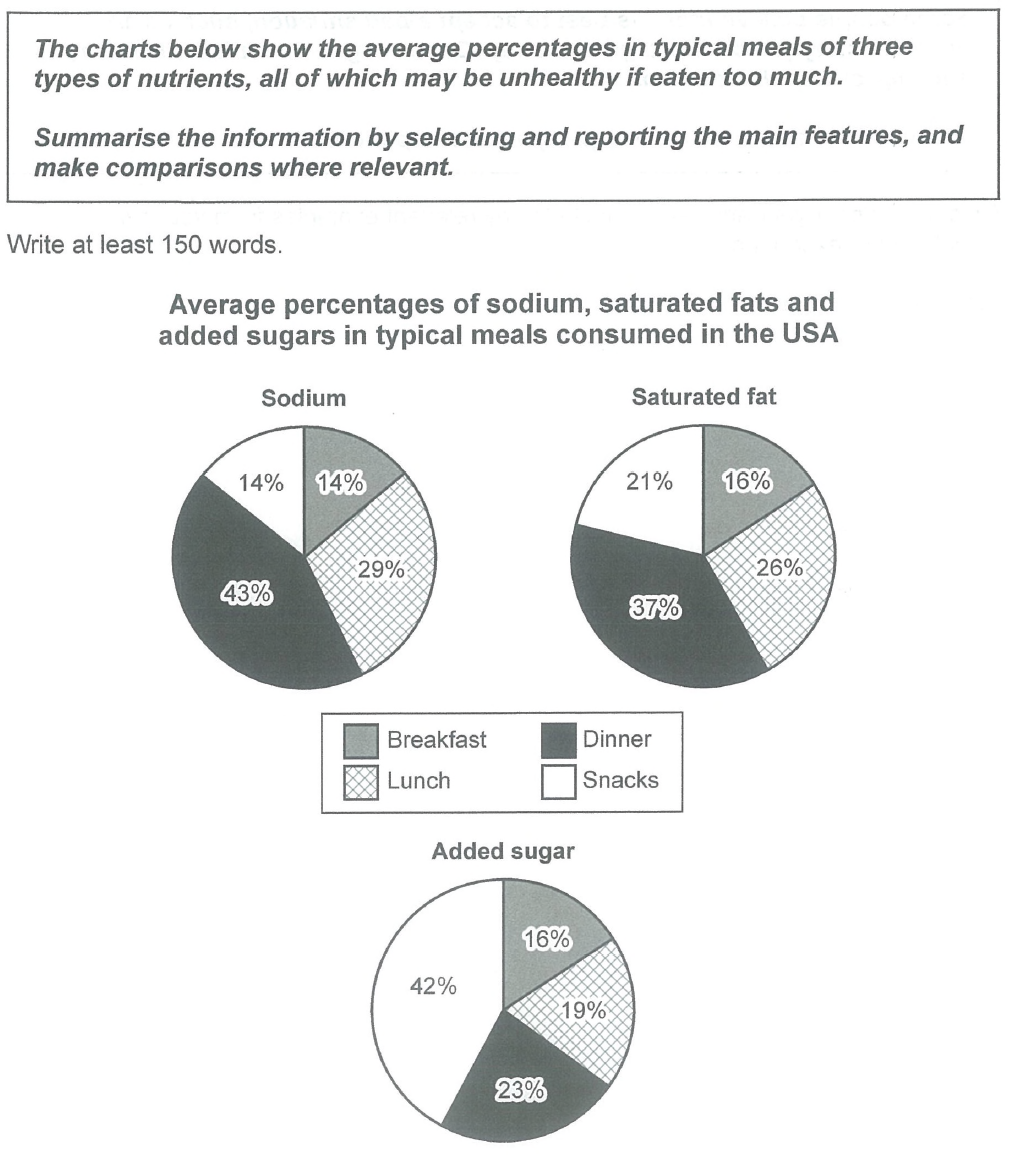
The diagrams show that the average rate of three types of nutrients in typical meals in the USA, which can be unhealthy if people eat them too much. The three types are sodium saturated fats and added sugar. This data is investigated by United States. (항목 나열은 따로 하지 않습니다.)
The first diagram illustrates the average percentages of sodium. Dinner accounts for the most sodium (43%). Breakfast and Dinner snacks indicate the same percentage of rates (14%), and 29% of sodium is consumed at lunch. The second chart shows a slightly different figure, which is saturated fat in meals. The biggest percentage of rate is dinner (37%), and the next one is lunch that shows 26% of saturated fat consumed. While eating snacks, 21% of saturated fat is consumed Eating snacks is consumed the saturated fat 21%. (여기서 엔터를 칠 이유는 따로 없습니다.)
The breakfast is the smallest percentage of rate (16%) in saturated fat. The third diagram indicates quite different results compare to other charts. It indicates the added sugar. The snacks account for a huge percentage(42%). By having dinner, added sugar is used 23% of added sugar is taken. Lunch and breakfast show each 19% and 16%.
To sum up, all the charts show that those three types of nutrients are consumed at least 14% in the United States. (task 1은 결론을 내기 위해 존재하는 글은 아닙니다. 이를 대신해서 Overview라는 것을 서론 밑에 넣어주시면 되는데, 대신 역할 자체는 결론과 거의 비슷해요. 다른 학생들의 글을 참고해보시면 대략 감을 잡으실 겁니다.) It tells people that it can be unhealthy when it is consumed too much.
총평: (6/5/6/6) 6.0
위에서 말씀드린대로 마지막 문단은 위치상의 변화가 필요합니다. 이는 모든 task1에 마찬가지로 적용되므로 참고해주시고, 또한 괄호가 너무 남발되지 않도록 주의해주세요. 괄호를 많이 쓰면 쓰는 학생들의 입장에서는 간편하지만, 점수에는 크게 좋은 영향을 주지 못합니다.
수고하셨습니다 :)

 비밀번호 확인
 댓글 0개
댓글 0개


 불편사항 신고