


 인쇄
인쇄


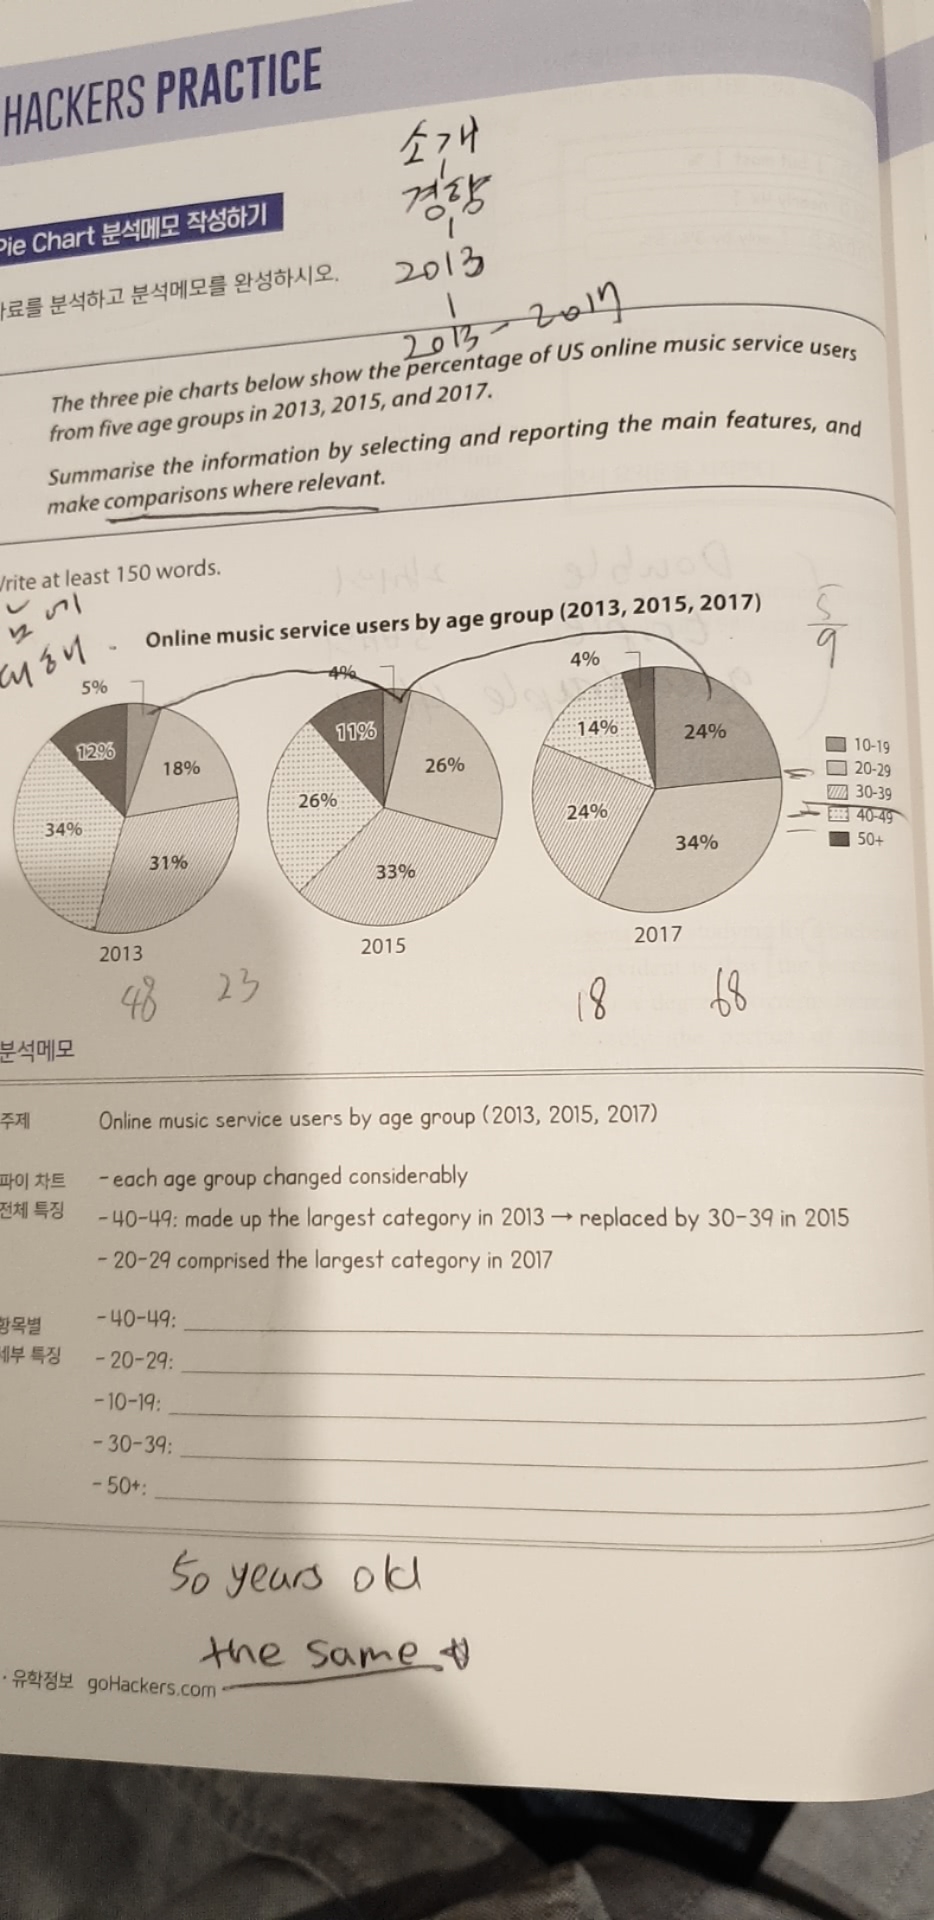
The three pie charts illustrate the percentage of US online music service users from five age groups in 2013, 2015, and 2017.
Overall, it is apparent that considerable changes were observed through all of the age groups. The percentage of the age groups over 40 years old dipped notably whereas the share of people under 30 increased significantly. The percentage of users in their 30’s fluctuated slightly.
Looking at the graphs more closely, one can see that the proportion of the oldest two age groups combined decreased significantly through the period in question, from 48 % in 2013 to 18 % in 2017. However, the share of the age group under 30 surged dramatically. It was only one-half of the proportion of the age groups over 40 in 2013, but its share became nearly 4 times larger in 2017.
The share of the age group between 30 and 39 did not show notable feature throughout the period in question, but decreased slightly.
해커스 교재 90페이지. 162자 입니다. 항상 감사드립니다.

 댓글 0개
댓글 0개


 불편사항 신고