


 인쇄
인쇄


저는 이렇게 적었습니다.
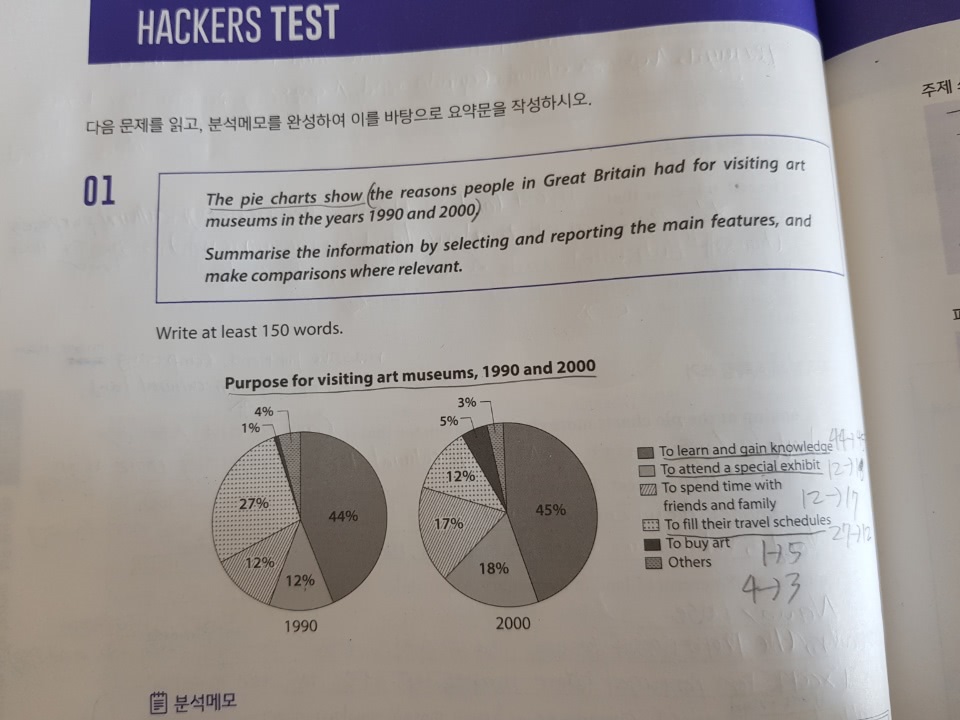
The two pie charts illustrate which purposes made people visit art museums over a decade period as a proportion of six five main and other categories.
Overall, it is obvious that the majority (여기는 총평에서 설명드리겠습니다.) of people visited art museums with the aim of acquiring knowledge in the years 1990 and 2000. Meanwhile, there were consistent changes in the portion of most categories. (consistent 라는 단어를 쓰려면, 항목마다 변화가 최소 세 번 정도는 있어야 합니다. 그러나 여기의 경우 각 항목마다 변화는 한 번에 그치므로 적절하지 않고요.) Then, that of people, who fill their travel plans, sharply decreased.
Looking at the graph more closely, one can see that the share of learning and gaining knowledge accounted for almost half of the total. Meanwhile While, there was an increase in the rate of people who visited art museums to that of people, who attend a special exhibit, so it became the second largest portion in 2000. Moreover, 27% of people visited art museums in order to fill travel schedules the second most in 1990, but they declined 15% point following a decade. (얘를 meanwhile 로 시작하는 문장보다 먼저 넣어주셔야 합니다. 그래야 기존의 2번째로 높은 항목은 뭐였는데, 2000년에는 뭐가 됐다~와 같은 자연스러운 전개가 가능하죠.) In spite of a rise by 4% points rising 4% point by aim of purchasing products in art museums, it still widened over the 10 years, whereas the portion of other purposes was lowest in 2000, remaining at 3%. (기타는 정말 특별한 경우가 아닌 이상 따로 다루지 않습니다.) (178 words)
항상 감사합니다. 비밀번호는 1234입니다. 저번에 첨삭해주신 point와 주어부분 매우 도움이 되었습니다.
총평: (6/6/6/7) 6.5
다른 부분은 위에 적어드린 사항을 참고해보시면 되겠고, 여기서는 정말 많은 수험생들이 틀리는 majority 에 관해서 말씀드릴게요.
분명 지식의 습득이 두 연도 모두 가장 높은 비율을 보인 것은 맞습니다. 그러나, 수치가 가장 높다고 해서 무조건 majority 를 끌고와서는 안 됩니다. 이건 '대다수의' 라는 의미를 가지고 있는 단어라, 아무리 못해도 70% 정도, 현실적으로는 80% 이상은 되어야 사용할 수 있어요. 이에 유의해서 수정해주세요~수고하셨습니다 :)

 비밀번호 확인
 댓글 0개
댓글 0개


 불편사항 신고