


 인쇄
인쇄


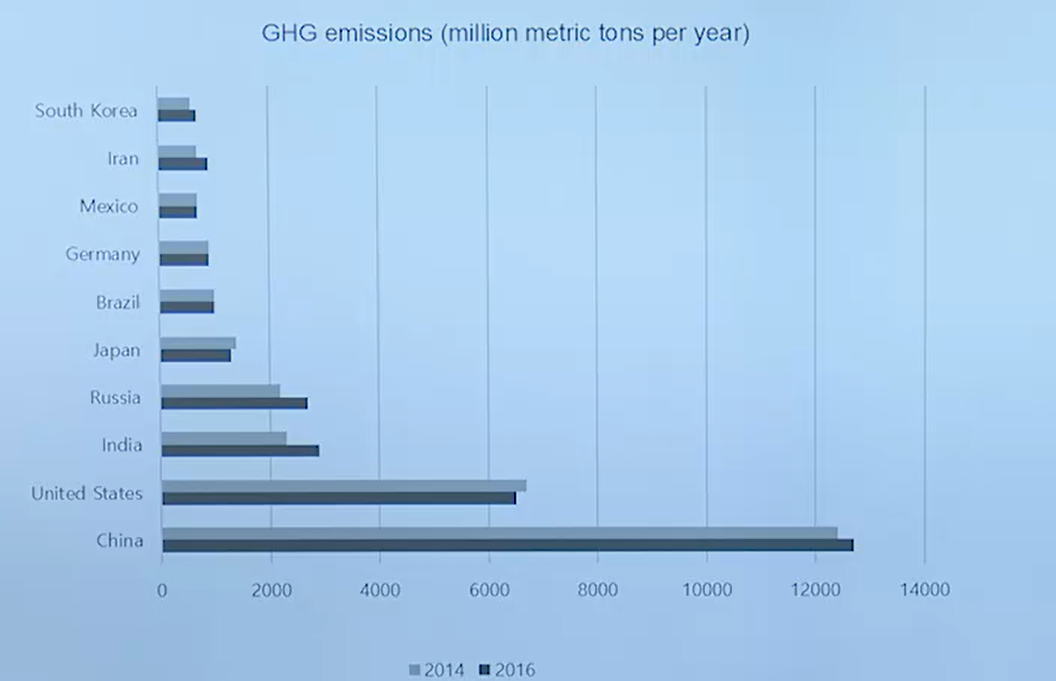
The bar graph illustrates greenhouse gas(GHG)
emissions of ten countries in 2014 and 2016. Overall, China is the far leading
emitter of greenhouse gases, while Japan and the United States were the only two countries that were able to reduced their total emissions.
With more than 12 billion metric tons of GHG emissions in both 2014 and 2016, China stands out as the top emitter. Remarkably, China’s total emissions are twice those of the United States, which follows China as the next top contributor. The other eight countries emitted around or less than just 2 billion metric tons. It highlights China’s excessive amount of GHG emissions.
In 2014 and 2016, only two countries managed
to reduce their emissions: Japan and the United States. Other countries as
Mexico, Germany and Brazil showed no change in their emission numbers between
the two years. On the chart, the remaining other five countries reported growth in their
total GHG emissions.
** 목표점수는 6.5 입니다! 감사합니다.
총평: (6/7/8/7) 7.0
시간 문제 없이 이정도로만 실전에서도 쓰실 수 있다면 6.5는 무조건 넘기시고, 7.0 이상도 충분히 가능할 겁니다. 굳이 아쉬운 점을 찾자면 세부적인 분석을 하면서 구체적인 수치가 들어간 부분이 많지는 않았다는 것이 되겠지만, 그래도 크게 문제는 안 될 거에요. 표현 자체가 워낙 깔끔하기 때문에 여기서 충분히 점수 벌어가실 겁니다. 수고하셨습니다 :)

 비밀번호 확인
 댓글 0개
댓글 0개


 불편사항 신고