


 인쇄
인쇄


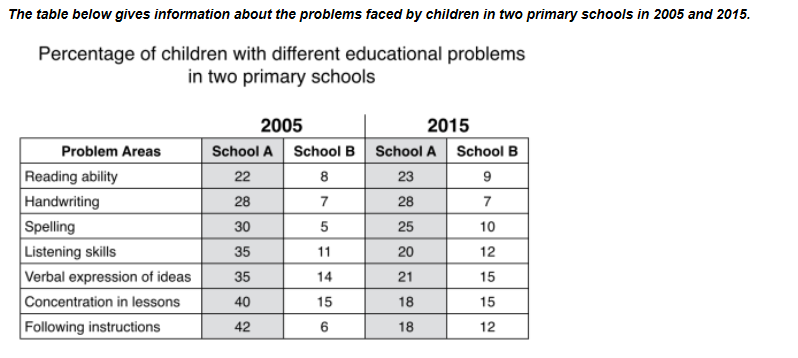
The chart given shows the percentage of students in two primary schools who faced various educational problems in 2005 and 2015.
With regard to the statistics in 2005, ‘Following instructions’ was
the biggest challenge that school A’s students were faced with 42 percentage while
the same problem was the least serious one in school B. The other problems
given affected around 22 to 40 percentage of students in school A. However,
students in school B have not faced that much. The biggest problem was ‘Concentration
in lessons’ that marked 15 percentage points.
However, after ten years, students in school A showed a reduction in the problems they faced (기존 표현이랑은 의미가 전혀 다릅니다. task 1에서는 이처럼 사소한 표현의 차이로 인해 의미 자체가 확 달라지면서 잘못된 분석으로 간주되는 경우가 많으므로, 특히 주의해주셔야 해요.) school A reduced educational problems they
faced. Specifically, the percentage of students that faced problems in ‘Following
instructions’ and ‘Concentration in lessons’ shrunk to less than half, and ‘Verbal
expression of ideas’, ‘Listening skills’, and ‘Spelling’ part also experienced
some advances. Meanwhile, School B has not maintained good statistics that it
have before. Except ‘Handwriting’, the percentage of students struggling has
increased in all problem areas including ‘spelling’ and ‘Following instructions’
that have doubled in its figures from 5 percent to 10 percent, and 6 percent to
12 percent respectively.
총평: (6/6/7/7) 6.5
현재의 두 번째 문단을 overview 로 의도하고 넣으신 건지, 아니면 어쩌다보니 그렇게 된 건지는 불명확하지만, 여하튼 조금 더 overview 의 성격에 맞게 수정이 필요합니다. 첫 번째로, 해당 문단이 overview 임을 대놓고 표현할 수 있어야 합니다. 이를 위해 Overall, In general 등의 표현을 넣어주시면 되고요. 또한, overview 에서는 말 그대로 큰 그림만 잡아주시면 됩니다. 즉 지금처럼 구체적인 수치가 들어가서는 안 돼요. 지금 자료를 바탕으로 봤을 때는, '비록 A가 B보다 두 연도 모두에서 종합적으로 높은 수치를 보였지만, 전자의 경우 10년 전과 비교해서 대부분의 수치에서 감소를 보인 반면 후자는 오히려 약간의 증가세를 드러냈다.' 정도를 적어주시면 됩니다. 수고하셨습니다 :)

 비밀번호 확인
 댓글 0개
댓글 0개


 불편사항 신고