


 인쇄
인쇄


목표점수 6.5
도움 없음
단어수 190
시간 30분
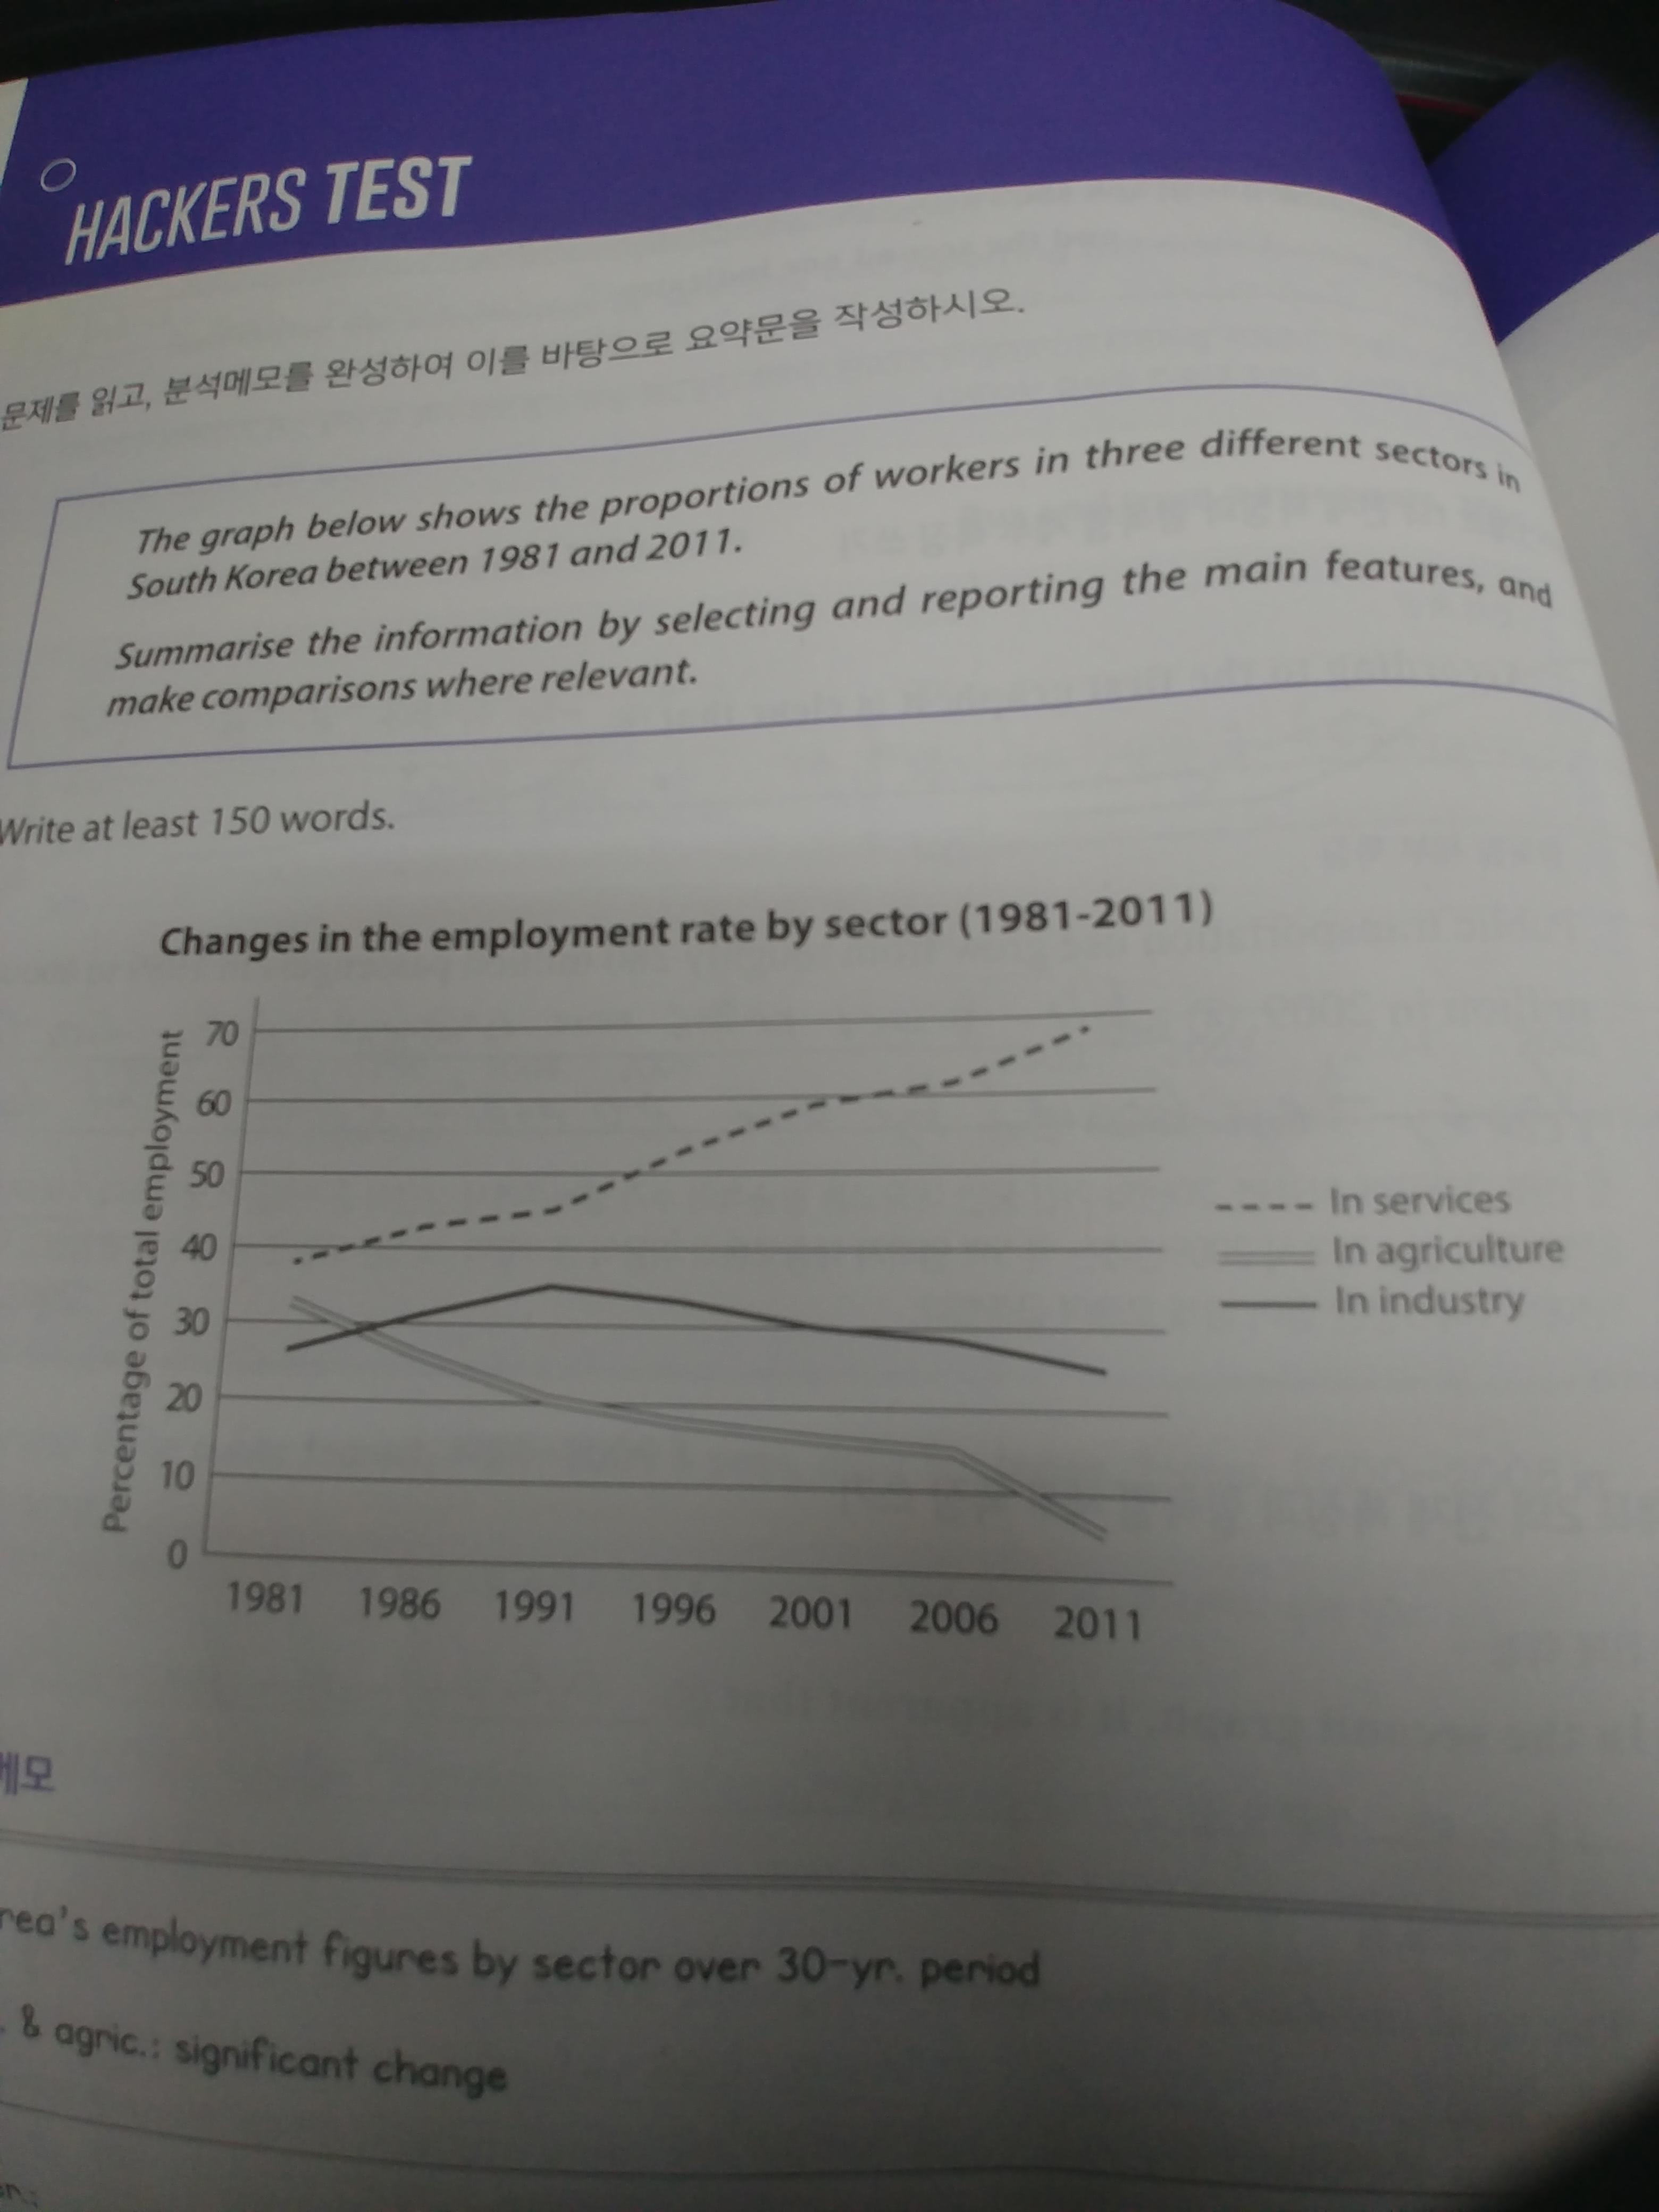
The line graph illustrates the portion changes of workers who worked in service, agriculture, and industry from 1981 to 2011 in South-Korea.
(들여쓰기 하실 거면 확실히 해주셔야하고, 그렇지 않을 경우 그냥 엔터 두번으로 쳐주세요~)
Overall, for period in question, the proportion of service workers has soared significantly. On the one hand, In in agriculture, the share has plummeted gradually and there were some fluctuations in industry field, but remained relatively stable as it comprised in 1981.
Looking at the graph more closely, one can see that the rates of workers in services sector was almost 40% and the biggest sector among three different sectors at the first year. It has increased until the last year in question and peaked at 70% in 2011. However, In case of agriculture sector, while the its rates had started 32% which was 80% of services sector's rate, it has plunged until 2011. Finally, it came to 5% (수치가 정확하게 떨어지지 않을 경우 함부로 확정짓는 게 아니라 '대략' 등의 표현을 써주셔야합니다.), one-sixths of its share in 1981. The proportion of worker in industry had percentage which was similar with agriculture at first. The rates of it had rose considerably between 1981 and 1991 before declining consistently from after. Originally, it made up 35% of the total percentage of total employment, finally, as a result of decreasing, it accounted for only 5%. Compared to the first and the last year in period, the biggest changes was the gap between service and agriculture. It had been only 10% (퍼센트포인트로 표시해주셔야합니다.) at first year, but at last, the percentage of service was almost 12 times of the other.
총평: (6/7/7/6) 6.5
시간 때문에 당연히 실전에서는 지금 당장 6.5까지 안 나오겠지만, 그래도 문법에서 크게 문제가 없었다는 점은 매우 긍정적이네요.
단 지금 시간을 줄여주셔야하는데, 그 방법으로는 연습도 있겠지만, 글자수를 줄이는 것도 있습니다. 모든 사항의 변화를 일일히 나열할 필요는 없으니까 중요사항만 집어서 요약하는 연습을 해주세요! '나열' 이 아닌 요약과 분석이 필요합니다.
또한 꺾은선 그래프에서는 수치 간 역전을 다루는 게 분석의 키가 됩니다. 이 경우 산업과 농업의 역전이 포인트가 되는데, 이와 관련해서도 넣어보세요! 수고하셨습니다 :)

 비밀번호 확인
 댓글 0개
댓글 0개


 불편사항 신고