


 인쇄
인쇄


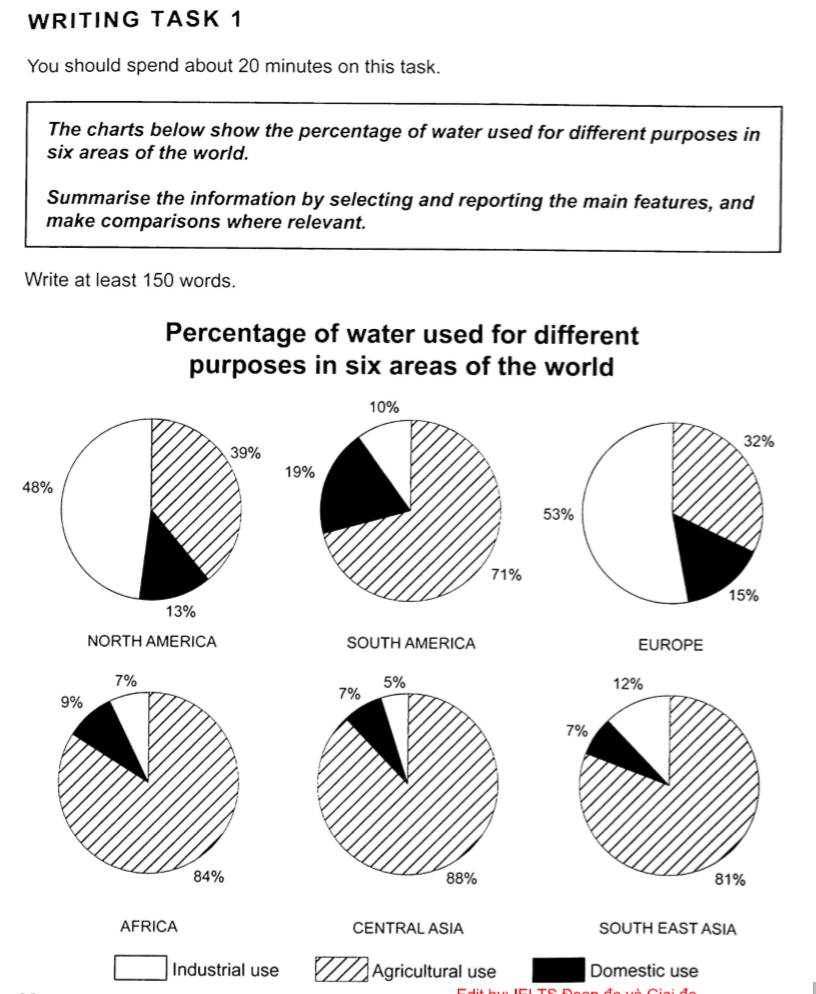
These diagrams show the proportion of water used for three purposes (like 는 전체 중 일부를 나열할 때에만 가능합니다.) like domestic, industrial and agricultural use in six areas in the world.
Overall, the most striking trend is that water for agriculture is significantly used in four places and the quantity of water for domestic purposes is the lowest on the whole figure in almost all areas.
As clearly seen from the diagrams, two thirds of regions use the most water for agriculture much. The figure for agricultural use is the highest in Central Asia, accounting for 88%. It is followed by Africa and South East Asia at about 84% and 81% respectively. (이것만 읽고도 네 개 지역이 어디인지를 파악할 수 있도록 수정해보세요~)
Turning to the figure for industrial, the percentage of the water is more than half halve in Europe, which is followed by North America, where it uses the water about almost half of the figure. However, the rest of areas use the water for industrial use at under one fifth.
총평: (6/6/6/6) 6.0
분석이 너무 부족합니다. 특히 마지막 문단의 경우 구체적인 수치도 거의 없고요. 또한 북미/유럽을 제외한 나머지 네 개 지역의 경우 분명 공통점도 있지만, 차이점도 있는데, 이것 역시 다뤄주셔야합니다. (일부러 그 내용에 대해서는 안 적었으니까, 꼭 직접 찾아보세요~이렇게 하면서 분석력을 기를 수 있습니다.) 수고하셨습니다 :)

 비밀번호 확인
 댓글 0개
댓글 0개


 불편사항 신고