


 인쇄
인쇄


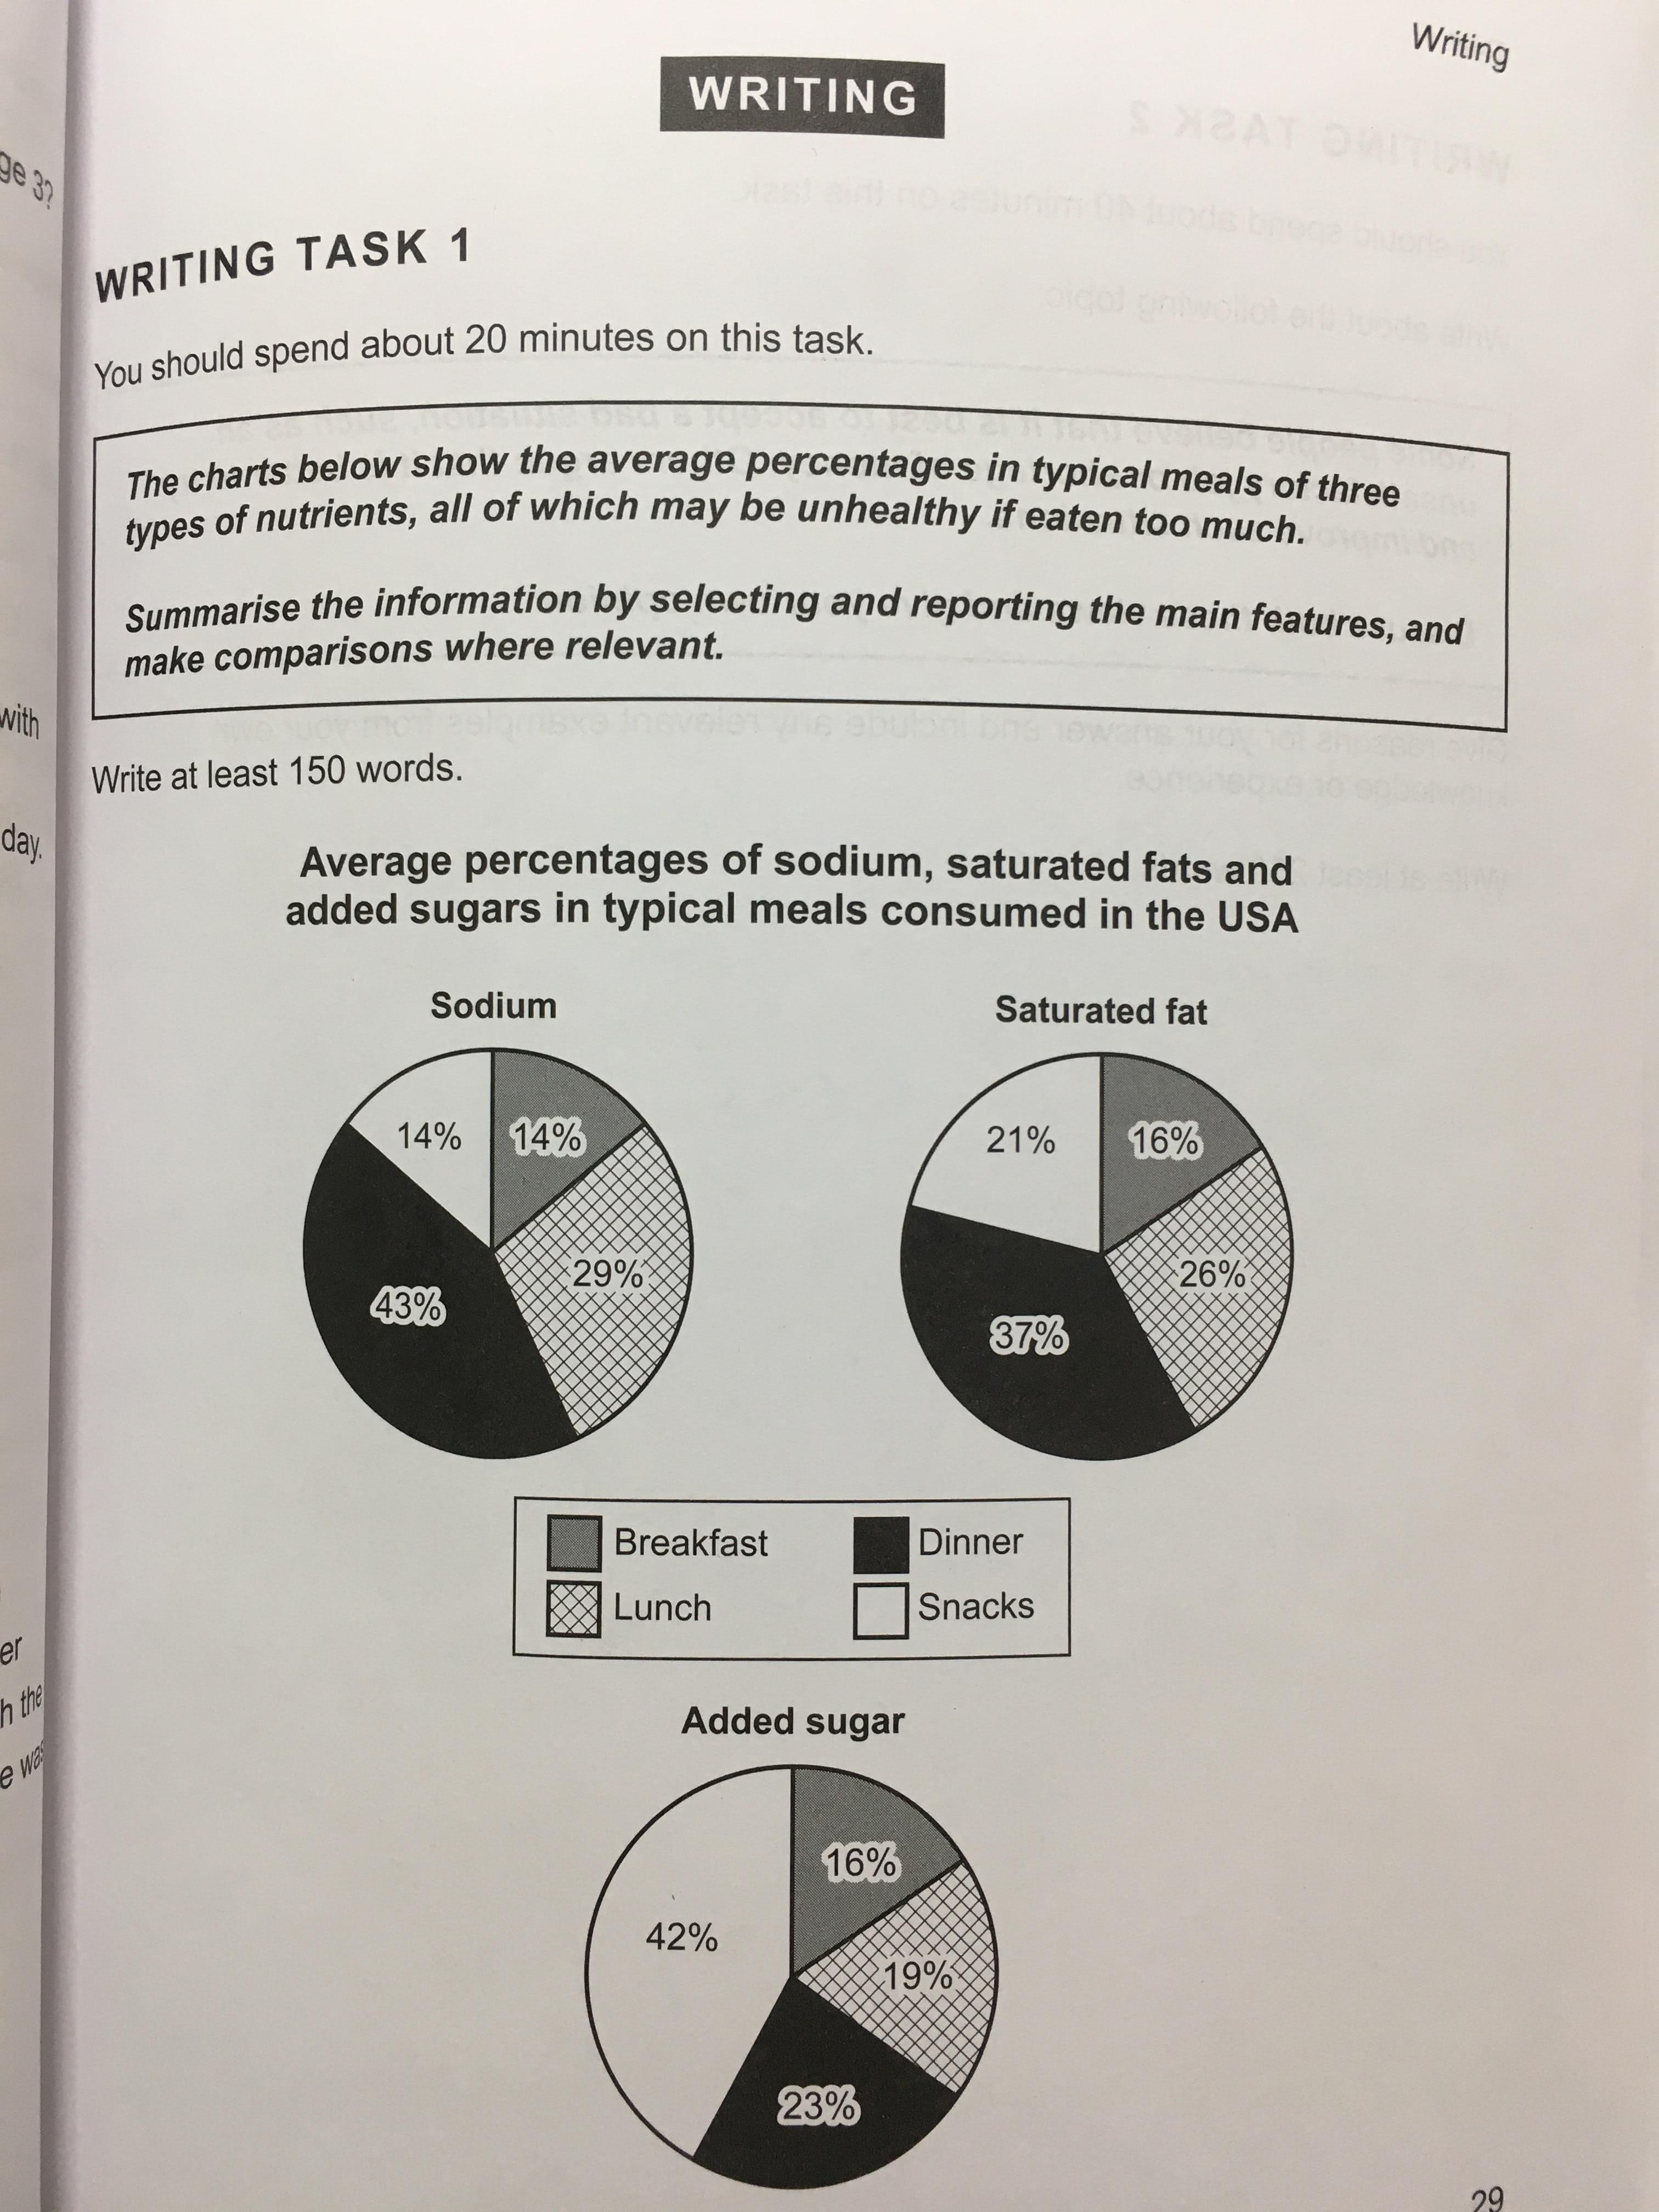
The pies indicate the average rates of three types of nutrients in typical meals, which could be unhealthy of consumed too much in the U.S.A
In sodium, there is the biggest rates of consumption at dinner to 43%. Lunch has recorded the second-highest rates. In contrast (앞과 반대되는 내용이 나오는 것은 아닙니다. 그냥 Meanwhile 등으로 적어주시면 돼요.), the percentage of sodium at the breakfast and snacks are taken up equal percents to 14% respectively.
In
case of saturated fat, dinner are occupied the highest proportion to 37% as
well as, the next biggest percentage of saturated fat has held at lunch,
which logged 26%. However, there is a slight increase in rates at the snacks
and breakfast compared to sodium, these are improved 7% to 21% and 2% to 16% (여기의 7과 2는 퍼센트포인트로 써주시면 되긴 하는데, 애초에 둘 간 차이를 굳이 빼서 계산할 상황은 아닙니다.).
To As for added sugar, it suggested quite a different proportion compared to the others. We can
see the largest rate of added sugar at the snacks to 42% whereas, there is
nearly a quarter percent of added sugar at the dinner dinner took a quarter of the total consumption. The percentage of breakfast is noted 16%, which is same as the rate of saturated fat. Finally, there
is 19% of added sugar at lunch.
총평: (5/6/6/5) 5.5
일단 task 1은 세부적인 분석이 잘 됐든 그렇지 못했든 떠나서, overview 가 없으면 절대 TR에서 5-6점을 벗어날 수 없습니다. (사실 overview 가 없으면 6점도 힘들어요.)
또한 지금과 같이 모든 항목을 일일히 나열할 필요도 없고, 그래서도 안 됩니다. 이 표를 잘 작성한 수험생의 글을 하나 보여드릴테니, 한번 참고해보세요~수고하셨습니다 :)
https://www.gohackers.com/?c=ielts/ielts_info2/ielts_writing&type=url&where=nic&keyword=oldsammy&uid=464308undefined

 비밀번호 확인
 댓글 0개
댓글 0개


 불편사항 신고