


 인쇄
인쇄


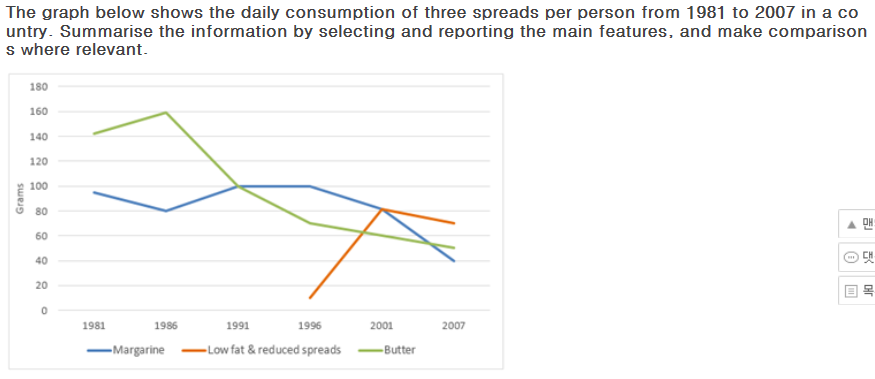
The chart given depicts the amount of spreads taken by a person per day between 1981 and 2007 in a country. Overall, the consumption of butter and margarine was decreased while low fat & reduced spreads’ consumption was increased in the given period.
With regard to the butter
consumption, after a short increase from 1981 to 1986, it maintained a steady
downward trend until the figure reaches 50 grams per day which is almost the one-third
of .1981’s. Margarine shows the similar trend with butter. After some fluctuations
between 1981 and 1996, the daily consumption of margarine per person which was
almost 100 grams in 1981 dropped to 40 grams in 2007.
Meanwhile, low fat & reduced spreads which was introduced to the market since 1996 became the major alternative of butter and margarine. (이 표현 좋습니다.) It reached its peak on 2001 with 80 grams of daily consumption per person. Though the figure was decreased (이미 한 번 쓰인 표현이고, 대체제가 정말 많으니까 잘 활용해보세요!) a bit from 2001 and 2007, it still remains as the most favored spread among three spreads given in 2007.
총평: (7/7/7/7) 7.0
잘 써주셨습니다. 두 가지에 대해서만 말씀드릴 건데, 먼저 문단 구분의 경우 엔터 두 번, 혹은 엔터 한 번+탭 한 번으로 해주시면 돼요. 지금처럼 엔터 두 번+탭 한 번은 안 해도 됩니다.
또한, 꺾은선 그래프에서는 수치 간 역전을 다루는 것이 중요합니다. 그 과정에서 항목 간 직접적인 비교가 되기 떄문이죠. 여기의 경우 크게 세 번 가량의 역전이 있는데, 세 개를 다 다루기는 어렵더라도 최소 한 개, 최대 두 개 정도는 꼭 언급해주세요~수고하셨습니다 :)

 비밀번호 확인
 댓글 0개
댓글 0개


 불편사항 신고