


 인쇄
인쇄


제가 작성한 답은 이렇습니다.
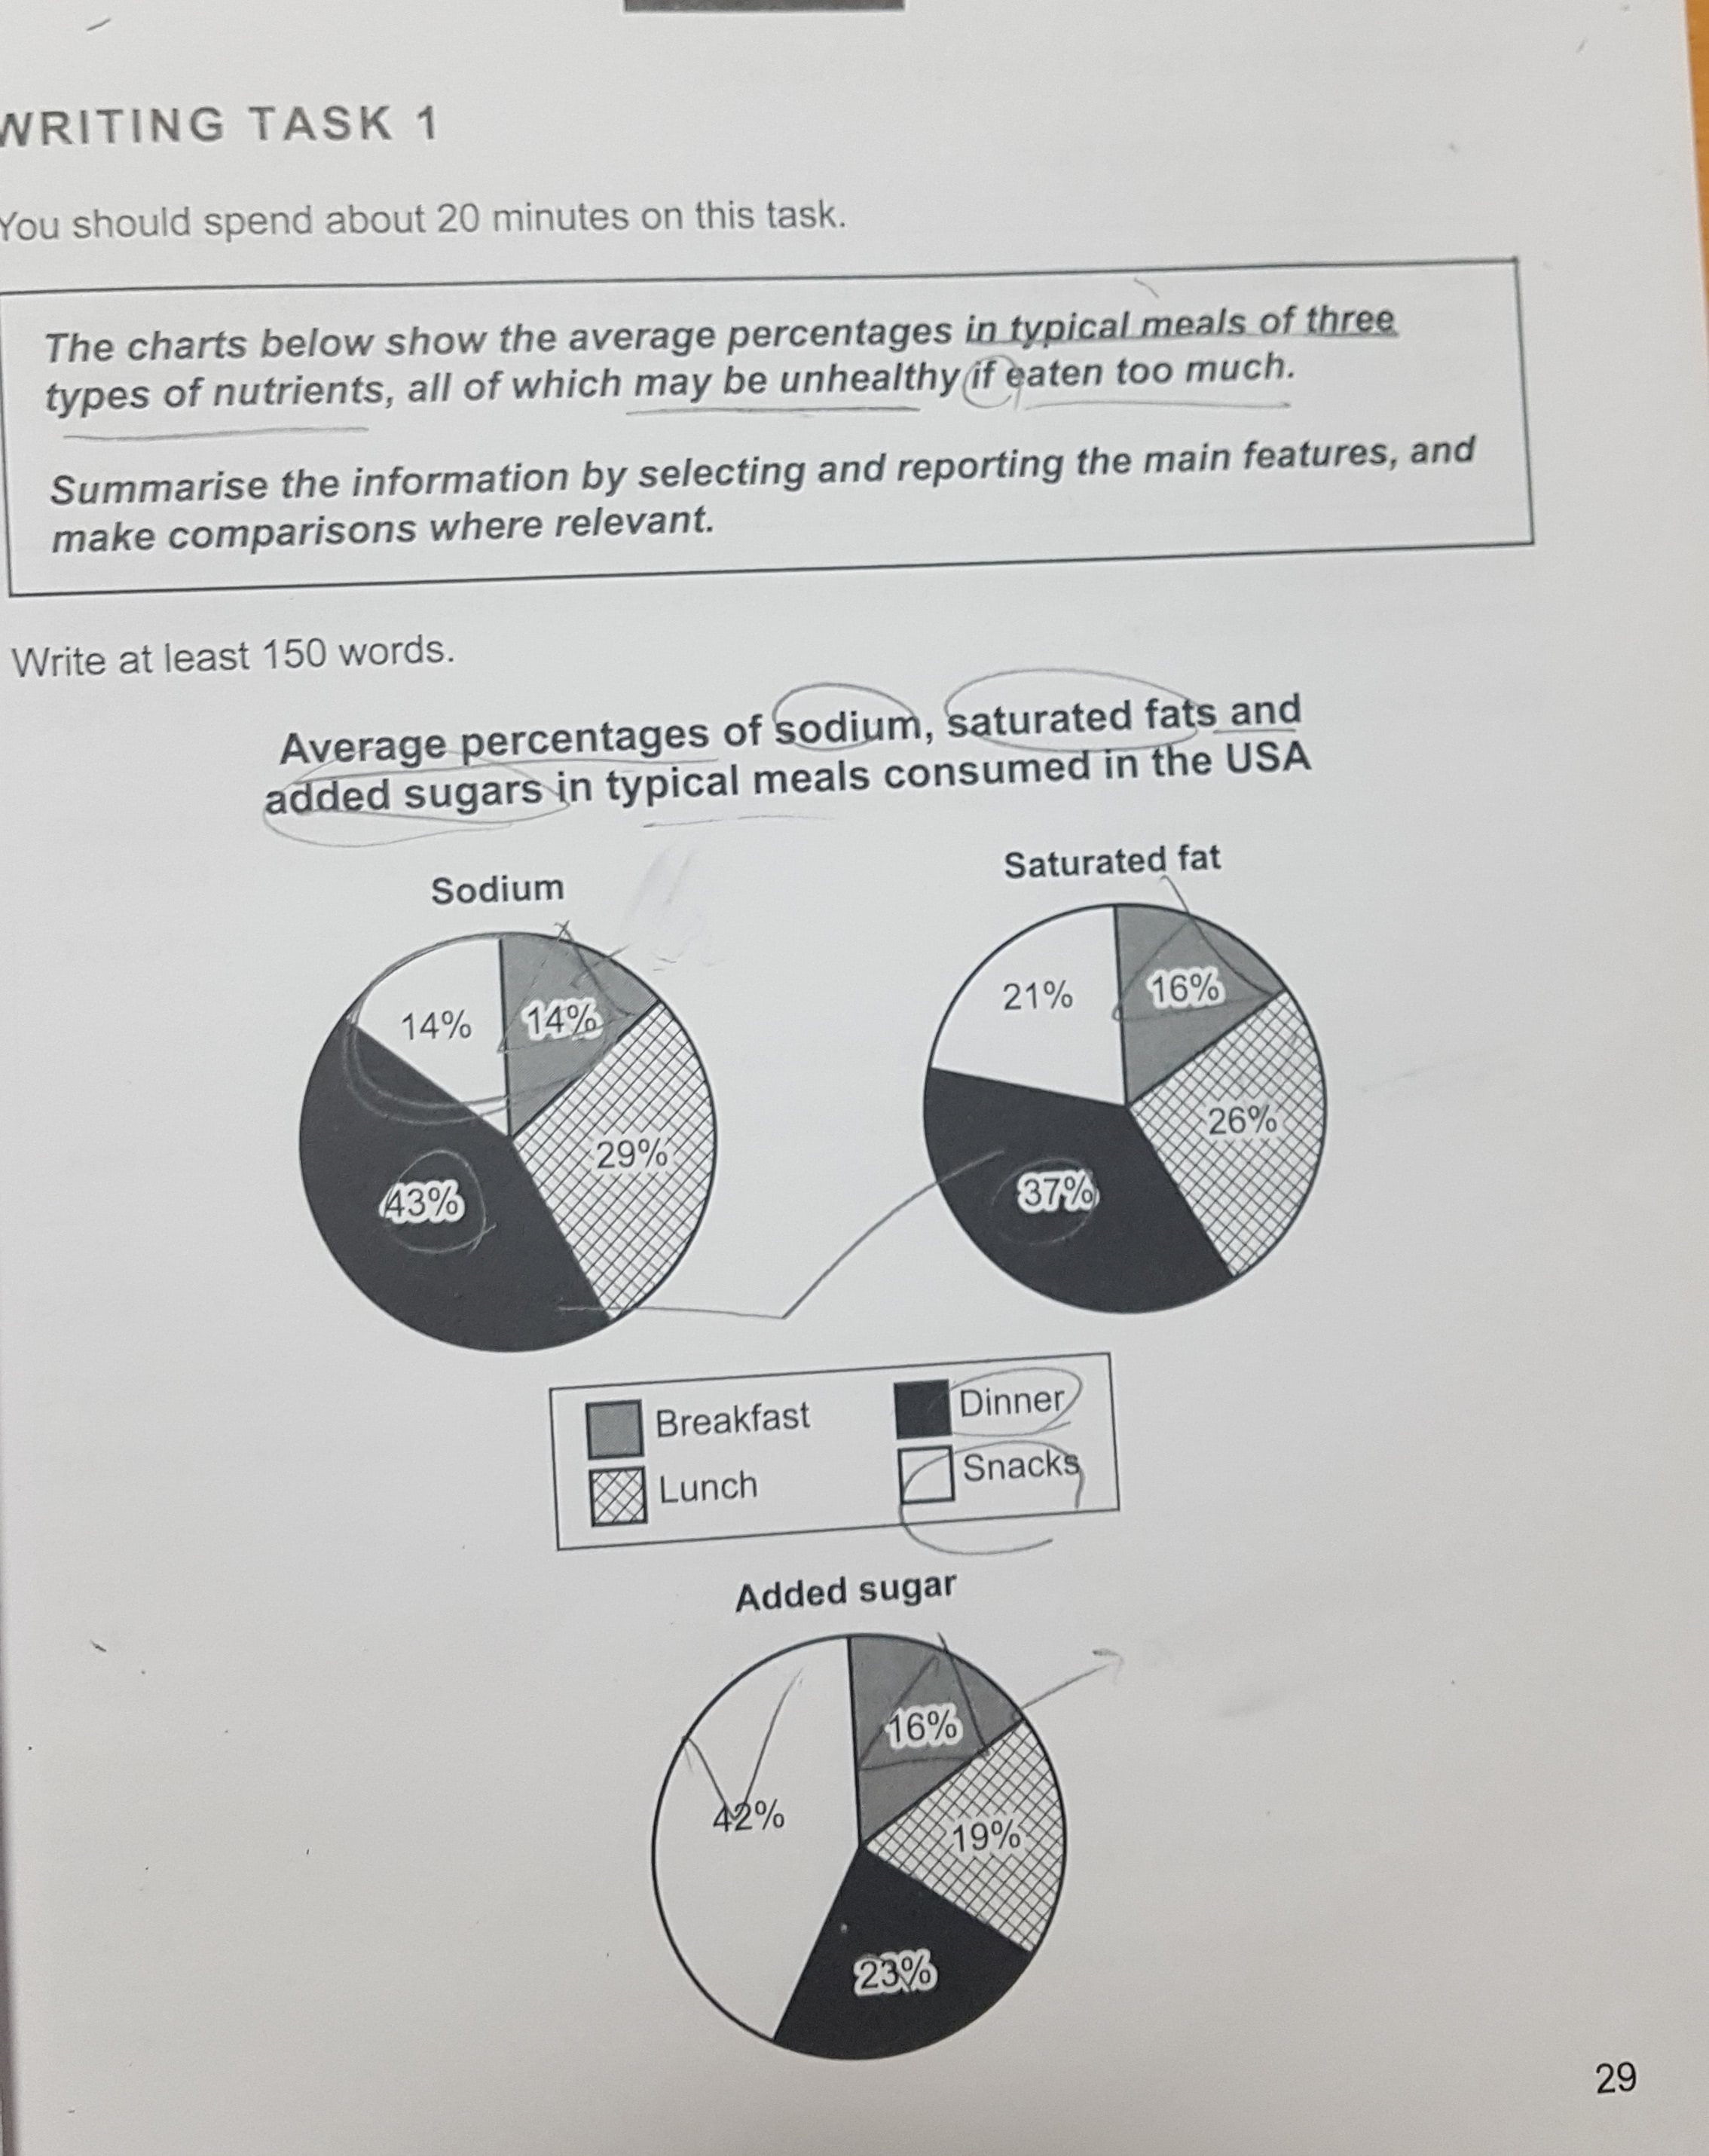
The pie chart shows the average percentages of sodium, saturated fats, and added sugars in typical meals.
Overall, it is clear that the percentage of sodium and saturated fat is the most highest in dinner but added suger is the biggest part in snacks.
Looking at the charts more closely, one can see that the chart of sodium has the same percentage at 14 % in snacks and in breakfast. In saturated fat's chart, the meal contained the most highest saturated fat at 37 % in dinner and this was followed by 26 % in lunch. In addition, all charts illustrate that the each rate of sodium, saturated fat, and added sugar in breakfast is the most lowest part in the charts. To be specific, the sodium rates and the rates of saturated fat are the most smallest at 14 % and at 21% in snacks.
** 게시일에 언급하지 못했으나 저는 최종적으로 8.0 을 받아야 합니다..ㅜㅜ
위의 에세이를 작성하는 데 총 18분 정도 걸렸고, 단어 수는 150개 내외 였습니다.
아직 많이 부족한 실력이지만 첨삭을 도와주시면 정말 정말 감사할 것 같습니다:)
틀린 부분을 가차없이 지적해주셨으면 좋겠습니다.

 댓글 0개
댓글 0개


 불편사항 신고