


 인쇄
인쇄


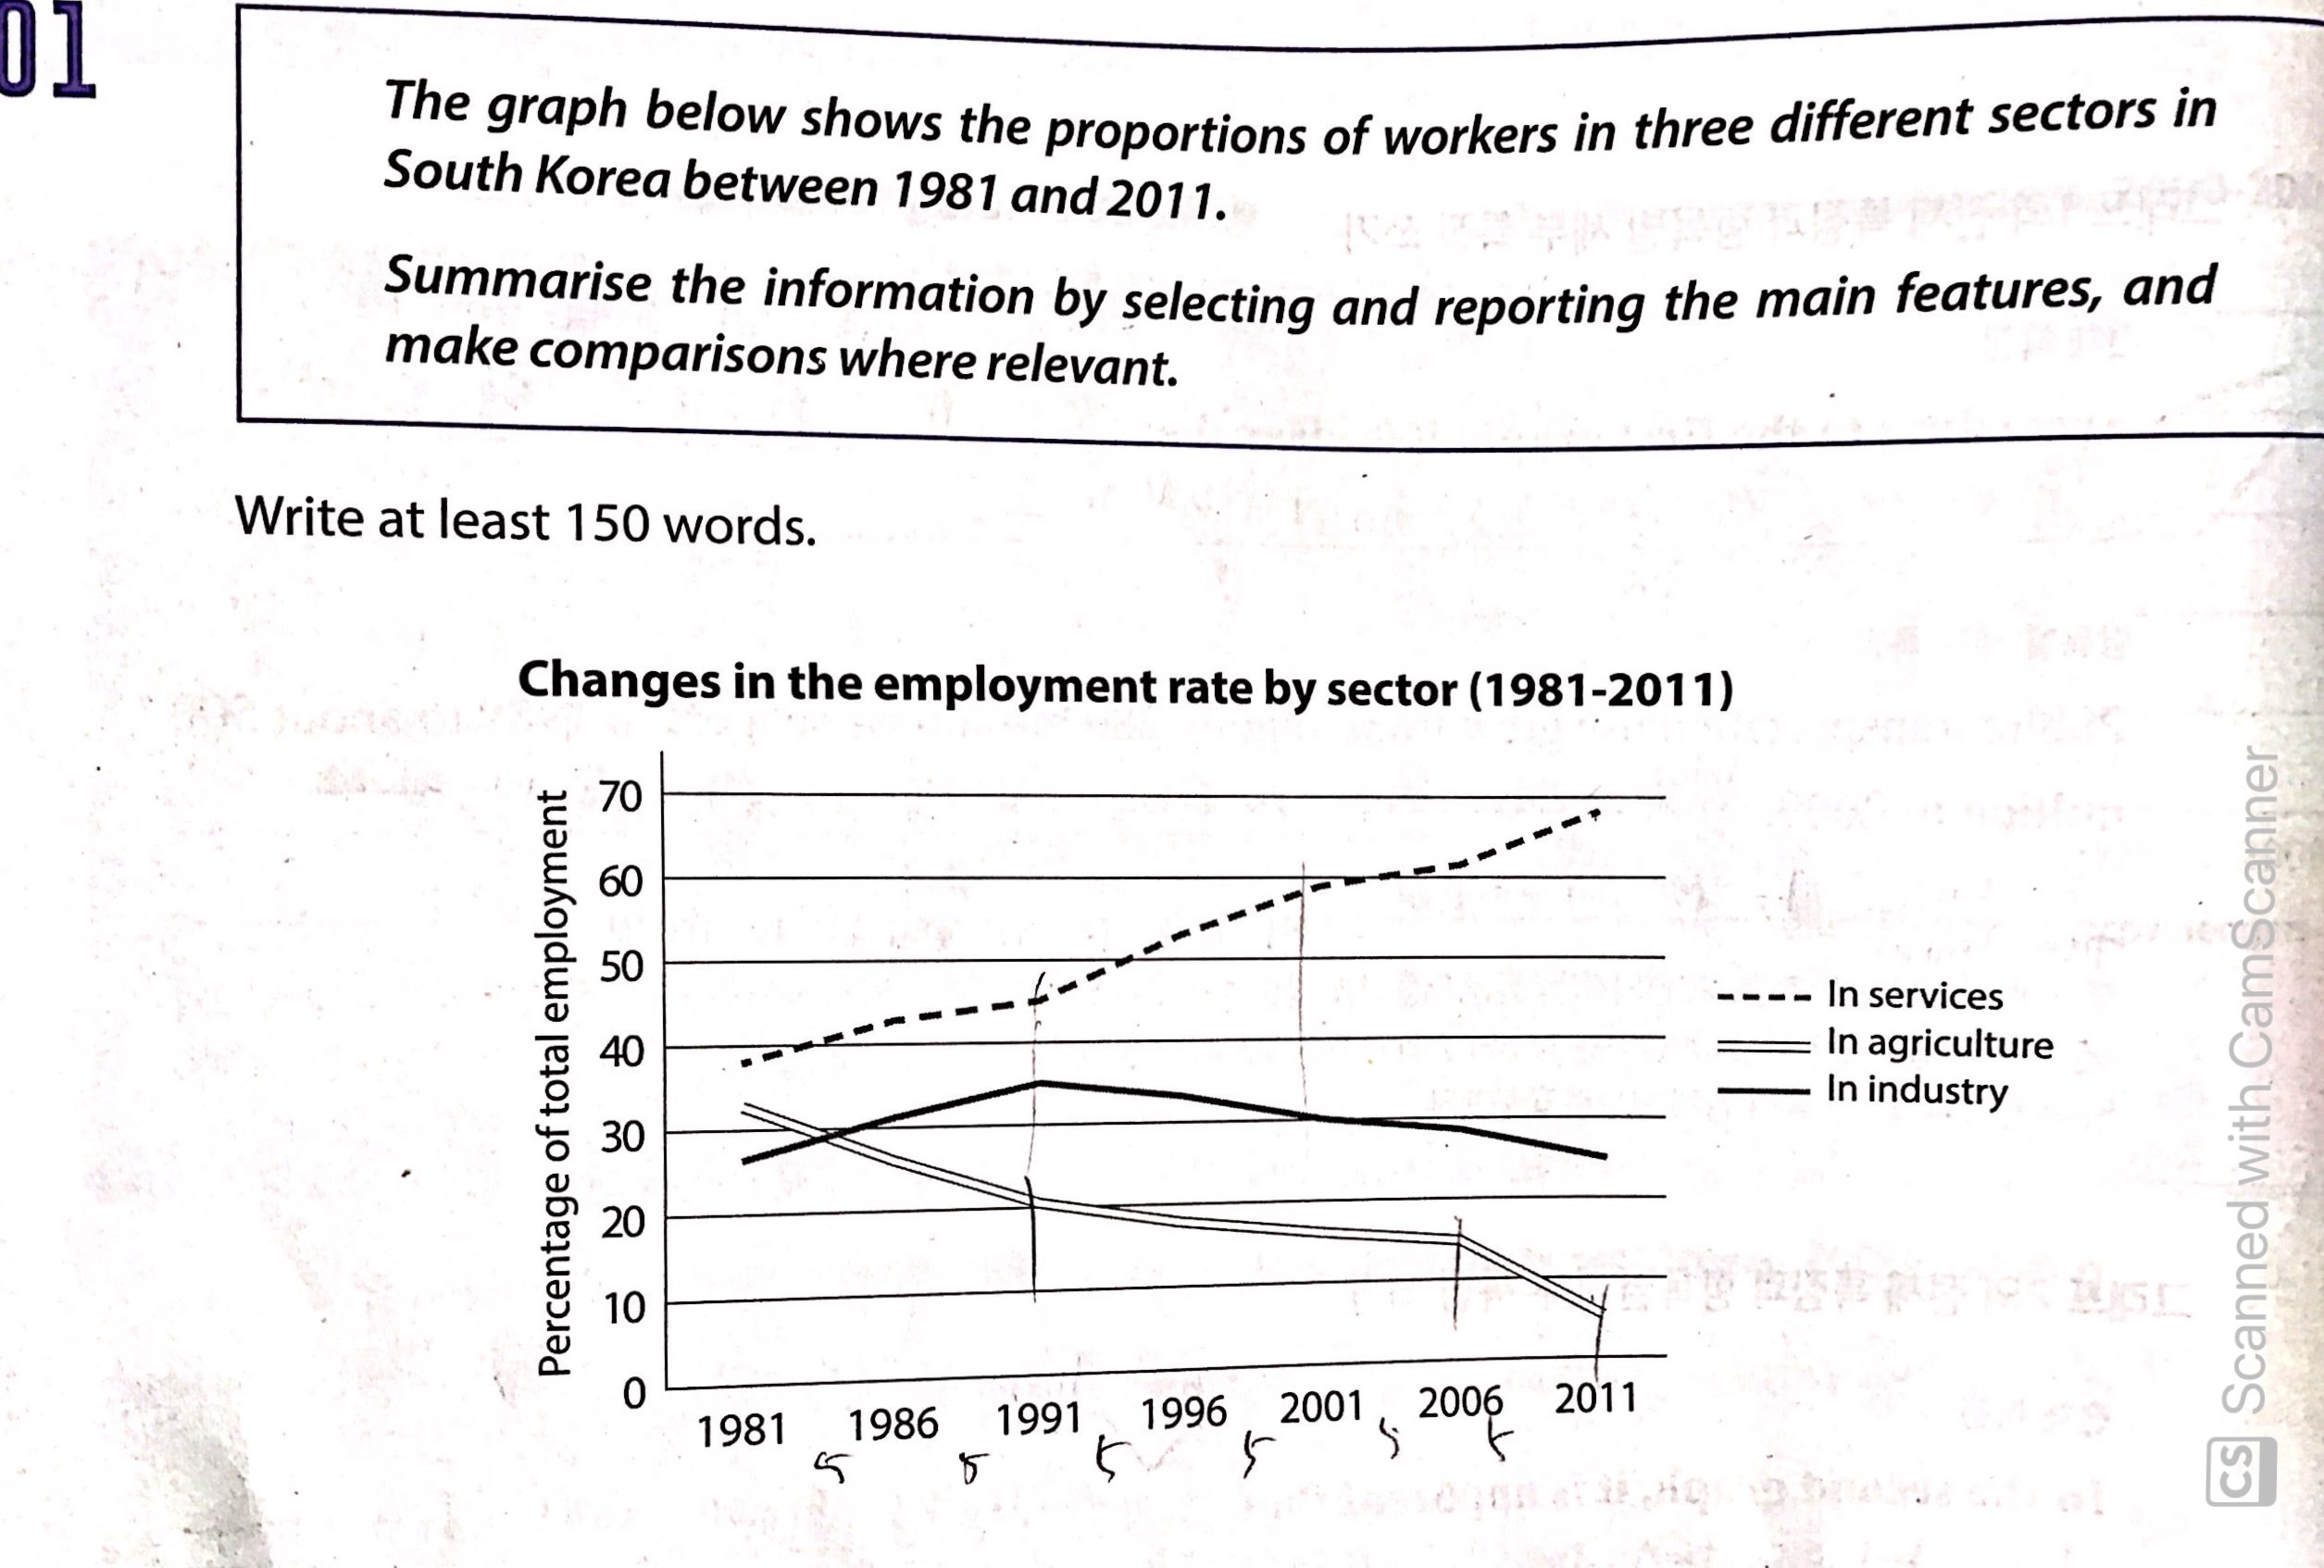
The line figure shows the rates of employment about services, agriculture and industry over 30-years period from 1981 to 2011 in South Korea.
According to data, there were significant change in service and agriculture workers. By the last year, the gap widened between services and agriculture than in 1981. However, industry workers fluctuated over whole period and there were few change between 1981 and 2011.
Looking at the graph more closely, one can see that the percentage of services surged from 1991 to 2001 over the 10-years period even though that increased steadily. Finally, it peaked at around 70% in 2011, which was more twice than combined others. In contrast, agriculture fell continueous and hit a low of under 10% in 2001. Industry went up and down, they rose bewteen 1981 and 991 but there were a downward trend following 1991. By 2011, compared to 1981, there were nealy no change.

 댓글 0개
댓글 0개


 불편사항 신고