


 인쇄
인쇄


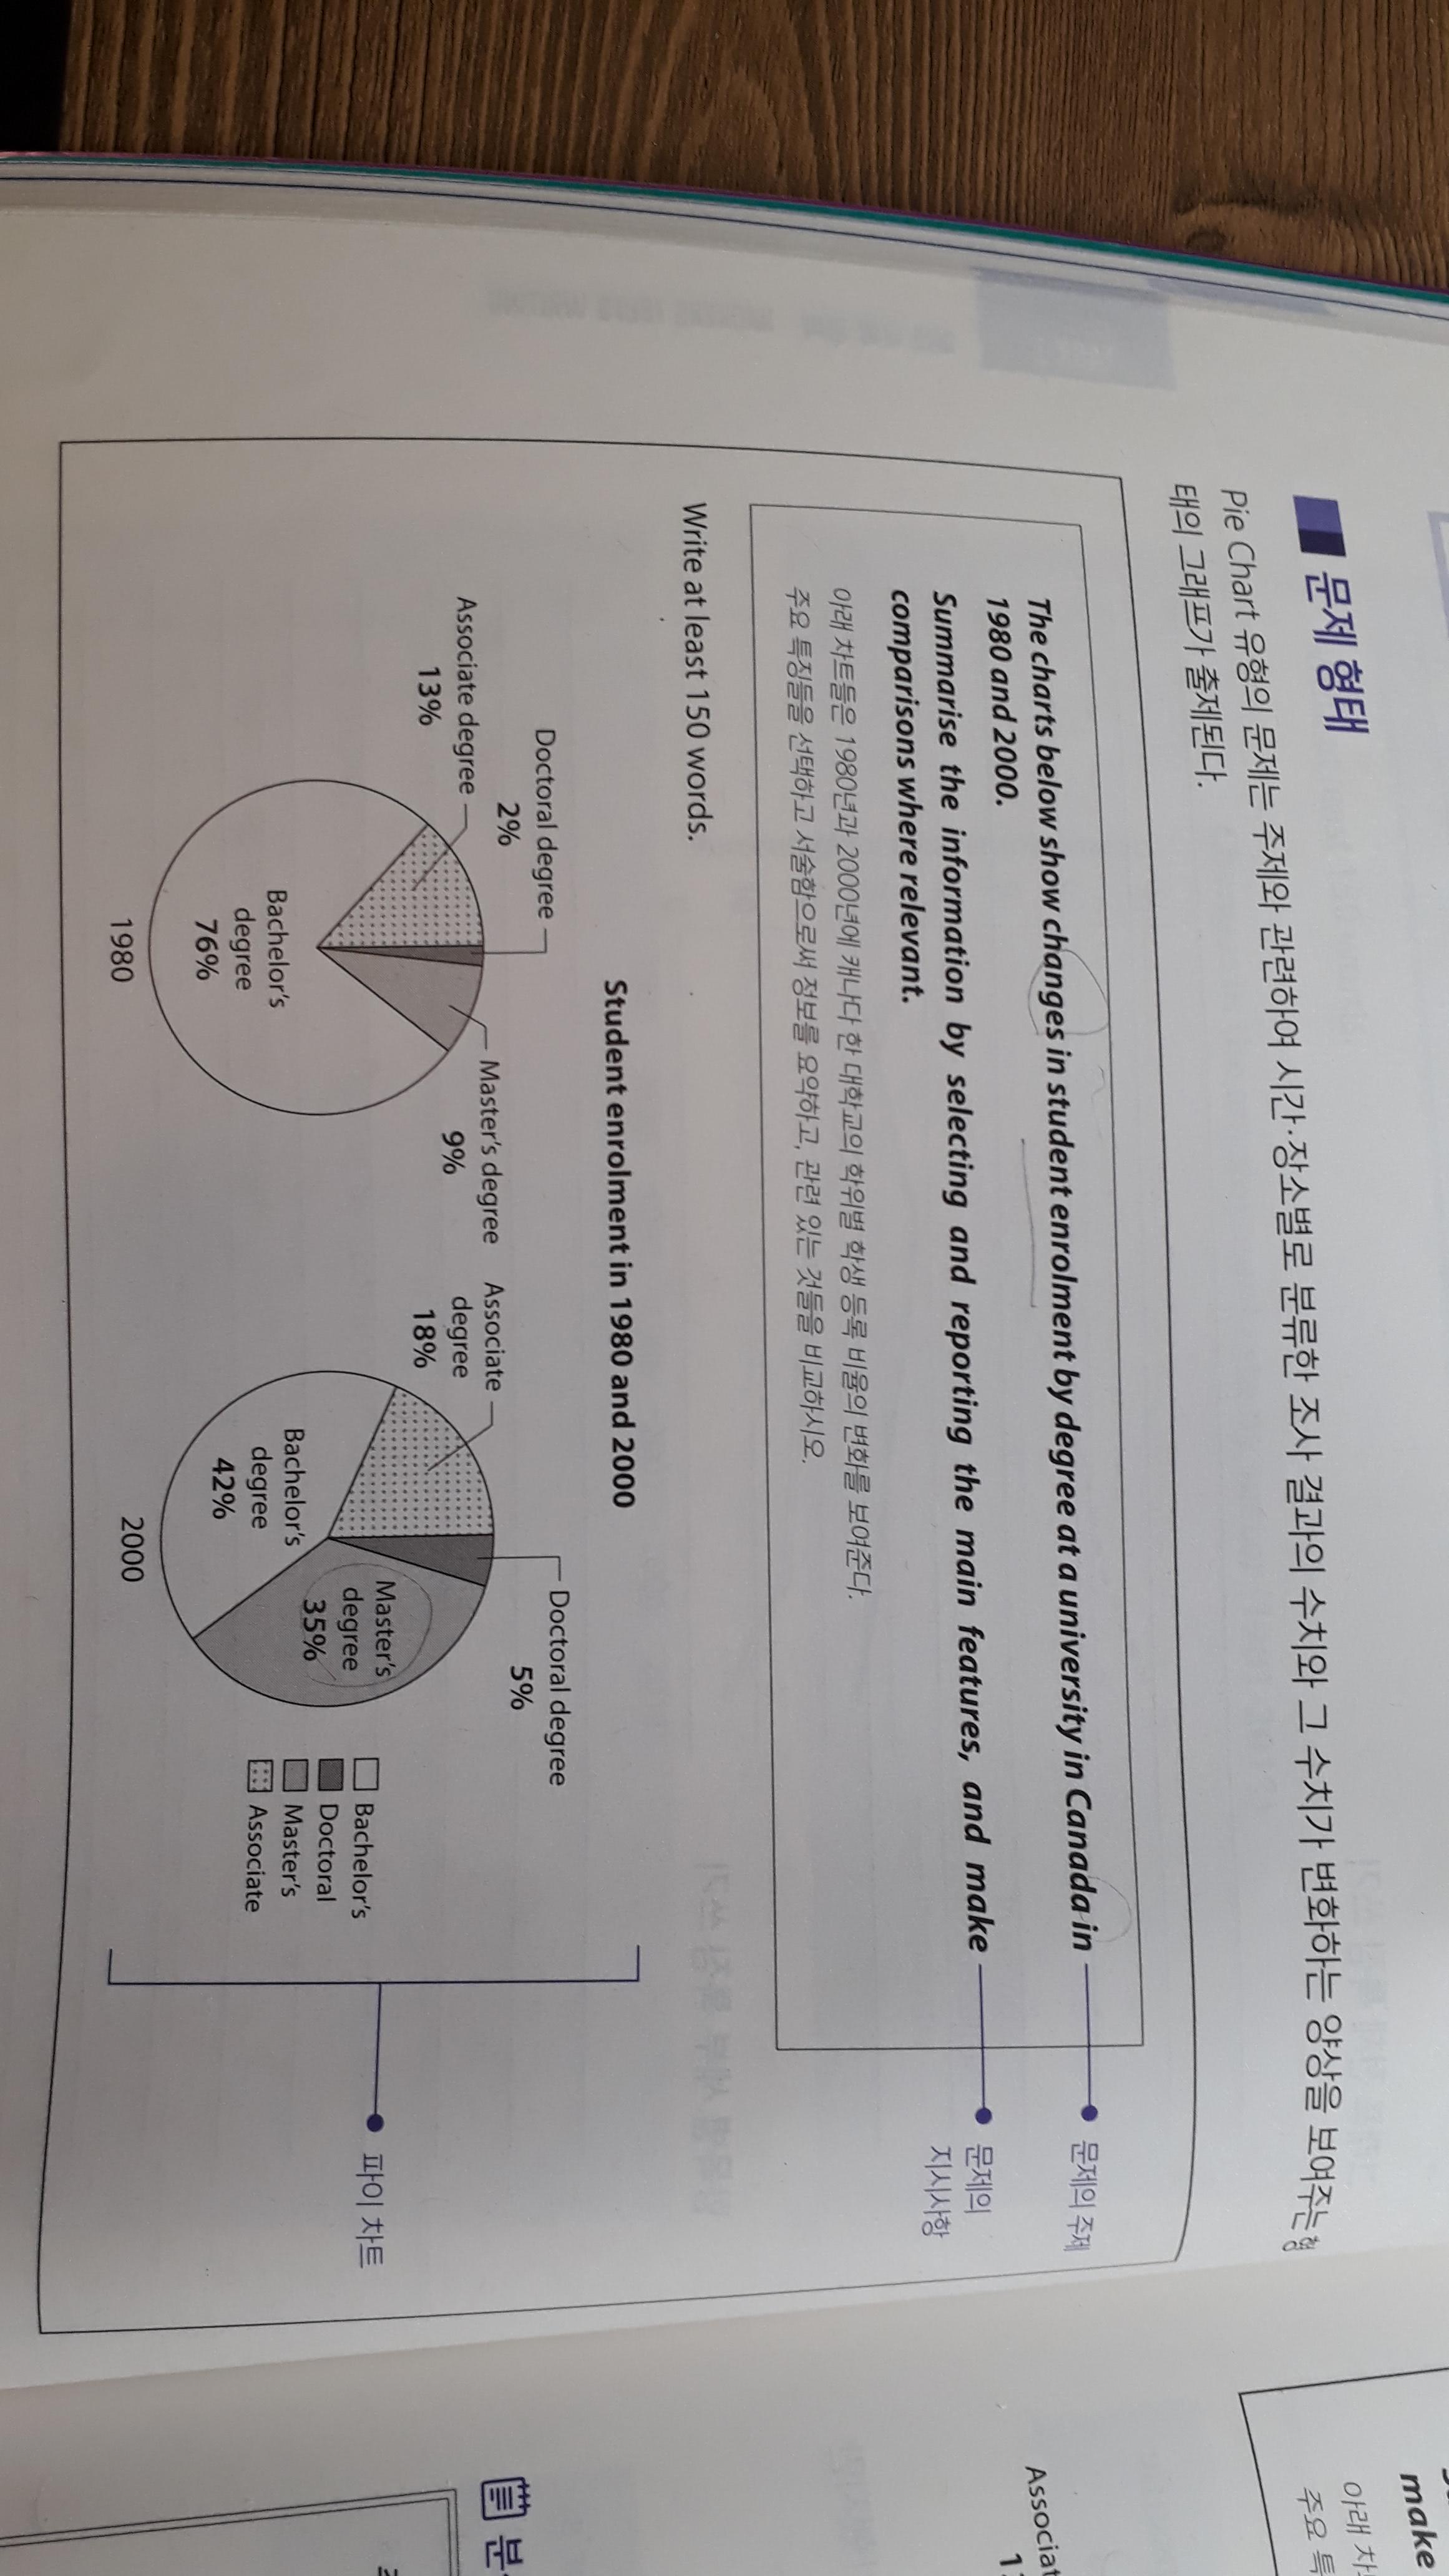
사진 돌릴 수가 없네요ㅠ
The pie charts compare the percentage of the college student enrolment by degree in Canda in 1980 and 2000.
According to the figures provided, the large rate of student enrolment was bachelor's degree in1980, while the percentages are more fairly allocated to all degrees.
As clearly seen from the first chart, the percentage of the students who enrolled bachelor's degree is by far the greatest, accounting for about three quarters. However, the figure in 2000 shows significant change, making up less than half at 42%.
It is interesting to note that the proportions of students who enrolled bachelor's degree and master's degree became similar in 2000 at 42% and 35% respectively. Also, except for bachelor's degree, all figure exprienced increses compared to counterparts, with the figure for master's degree rosing 26% points.
다음 시험: 2/8
시간: 21분 (아무 도움X)
목표점수: 6.0 (최소 5.5)
파이차트는 뭔가 쉽지 않네요. 어떤 부분을 보강하면 좋을까요??

 댓글 0개
댓글 0개


 불편사항 신고