


 인쇄
인쇄


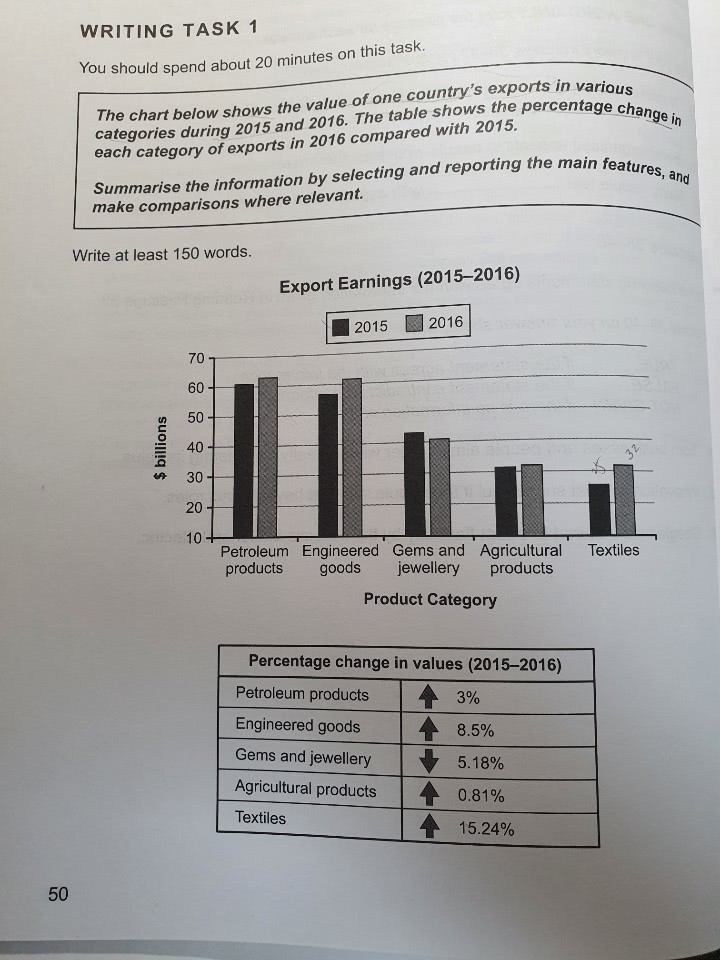
The bar chart shows one country’s Export
Earnings (소문자 시작입니다. 참고로, '시험장에서' Task 1 대소문자가 헷갈리시면 그냥 소문자로 찍으세요~그러면 90% 이상 맞을 겁니다.) in five categories from 2015 to 2016, and the table illustrates the
changing of proportion in each category of exports between 2015 and 2016.
Overall, it is clear that an upward trend
was seen in all of the categories except for gems and jewellery in both given
charts.
According to the bar chart, it is apparent
that both petroleum products and engineered goods showed similar patterns which
accounted for the highbest export earnings. They were earned around 60 billion dollars
in 2015 and surpassed 60 billion dollars in 2016. In contrast, gems and
jewellery was earned about 42 billion dollars in 2015, but it fell slightly to
40 billion dollars. Also, the biggest notable increase was seen in the category of
textiles.
In the second graph, the percentage of
textiles increased the most to by 15.24 percent, while agricultural products rose
the least to by 0.81 percent. Most categories showed an increase, but gems and
jewellery went down by 5.18 percent in 2016 compared with 2015.
166자
목표 6~6.5
감사합니다!
총평: (6/7/6/6) 6.5
하나의 글로 속단할 수는 없지만, 그래도 이전에 비해 문법이 어느정도 안정된 것 같다는 점은 긍정적입니다. 이번 글에서도 최소한 틀린 사항들이 많지는 않았고요. 물론 아직 6.5가 안정적으로 보장된다고 말할 수는 없으나, 최소한 6.0은 무조건 확보할 겁니다.
수고하셨습니다 :)

 비밀번호 확인
 댓글 0개
댓글 0개


 불편사항 신고