


 인쇄
인쇄


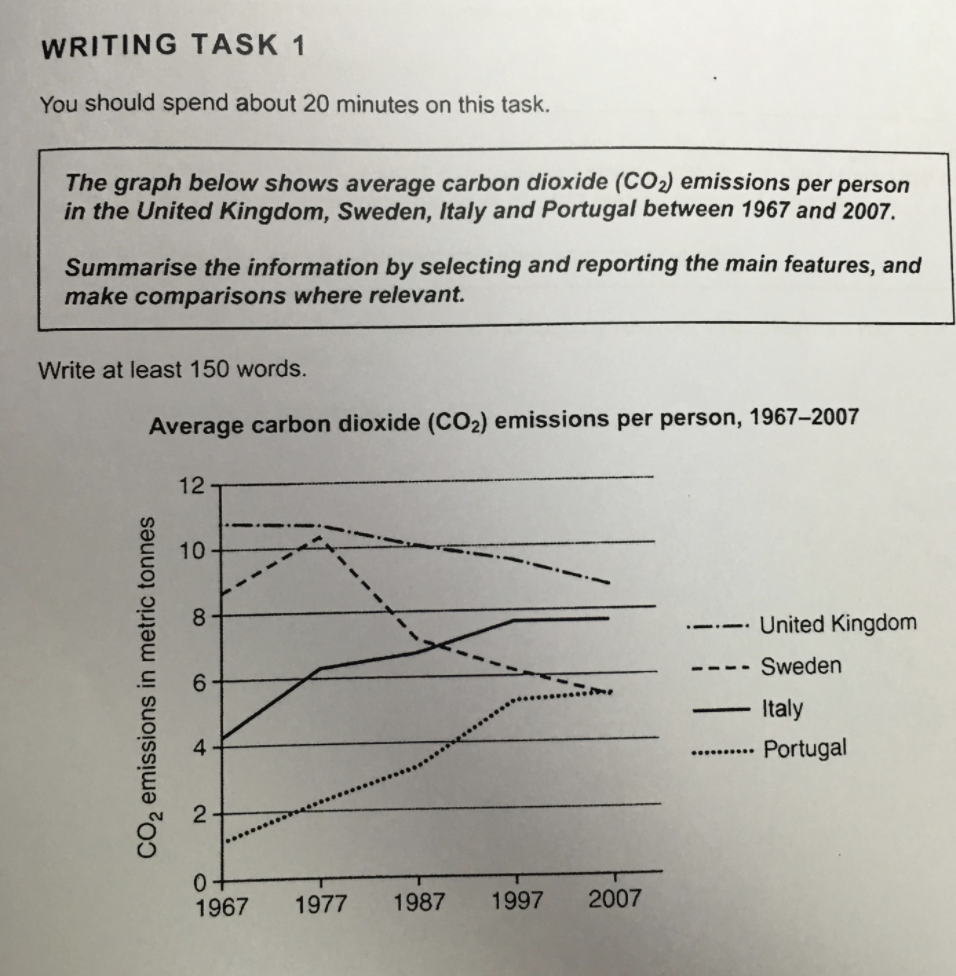
The given chart gives information about how carbon dioxide emissions per person had changed in the United Kingdom, Sweden, Italy and Portugal in the average from 1967 to 2007. In general, (쉼표 꼭 넣어주세요!) Italy and Portugal showed a steady increase of average Co2 emissions per person over time, while however, the United Kingdom displayed a steady (바로 앞에 있는 단어이므로 웬만하면 대체해주세요!) decrease. Meanwhile, in Sweden there were steep increase and decrease of average Co2 emissions per person.
On closer inspection, between 1967 and 2007 the average Co2 emissions per person in the United Kingdom was consistently the highest constantly, while although it had been on decrease throughout the given period. In 1967 the United Kingdom reached its highest emissions with around 11 metric tonnes, however, in 2007 around 9 metric tonnes. Sweden and Portugal indicated similar inclination, which showed a general increase. In 1967 Co2 emissions in Sweden and Portugal was 1 metric tonnes and 4 metric tonnes approximately, while in 2007 the former increased to around 7.8 and the latter, around 5.7 metric tonnes. Sweden showed noticeable changes in its figures. From 1967 to around 1978, it displayed a steep increase (얘랑 decrease가 현재 너무 자주 쓰이고 있습니다.) from 8.5 metric tonnes to 10.3 metric tonnes. However, between around 1978 and 1987 the emissions decreased drastically to around 7 metric tonnes.
항상 감사들비니다!
총평: (7/6/6/6) 6.5
시간 문제만 없으면 이정도로도 6.5는 충분합니다. 그러나, 한 가지에 대해서만 말씀드리자면, 지금 단어의 반복이 꽤 잦은 상황입니다. 특히 increase/decrease가 그렇고요. 이 두 단어는 Task1 표 문제에서 정말 많이 쓰일 건데, 대신 동의어 역시 정말 많습니다. 고로 모범답안을 잘 분석해서 이들에 대한 동의어를 잘 익혀주세요!
수고하셨습니다 :)

 비밀번호 확인
 댓글 0개
댓글 0개


 불편사항 신고