Your Answer ▼
The two charts show the changes in the export earnings and the export products' values in a particular country between 2015 and 2016, which consists of five categories: Petroleum products, Engineered goods, Gems and jewelry, Agricultural products, and Textiles.
Overall, it is clear that product value was affected by their export revenue, as product revenue and value fluctuations show similar patterns of increase and decrease during the period.
The bar graph shows that petroleum products and engineered goods were the most profitable in the country. These earnings rose to more than $60 billion in 2016, while figures for agricultural products and textiles increased by only nearly $30 billion over the period. On the other hand, gems and jewelry were the only ones to fall from $ 43 billion in 2015 to $41 billion in 2016.
Moreover, the table chart shows similar changes in product export revenue and the value of export products. In particular, the percentage of textiles value increased to 15.24% over the year, the highest increase among all export goods, with a yield of $26 billion to $32 billion. In addition, agricultural products had the smallest increase rate in product value and revenue among all export products, with a value increase of less than 1% and a return of $31 billion over two years.
|


 인쇄
인쇄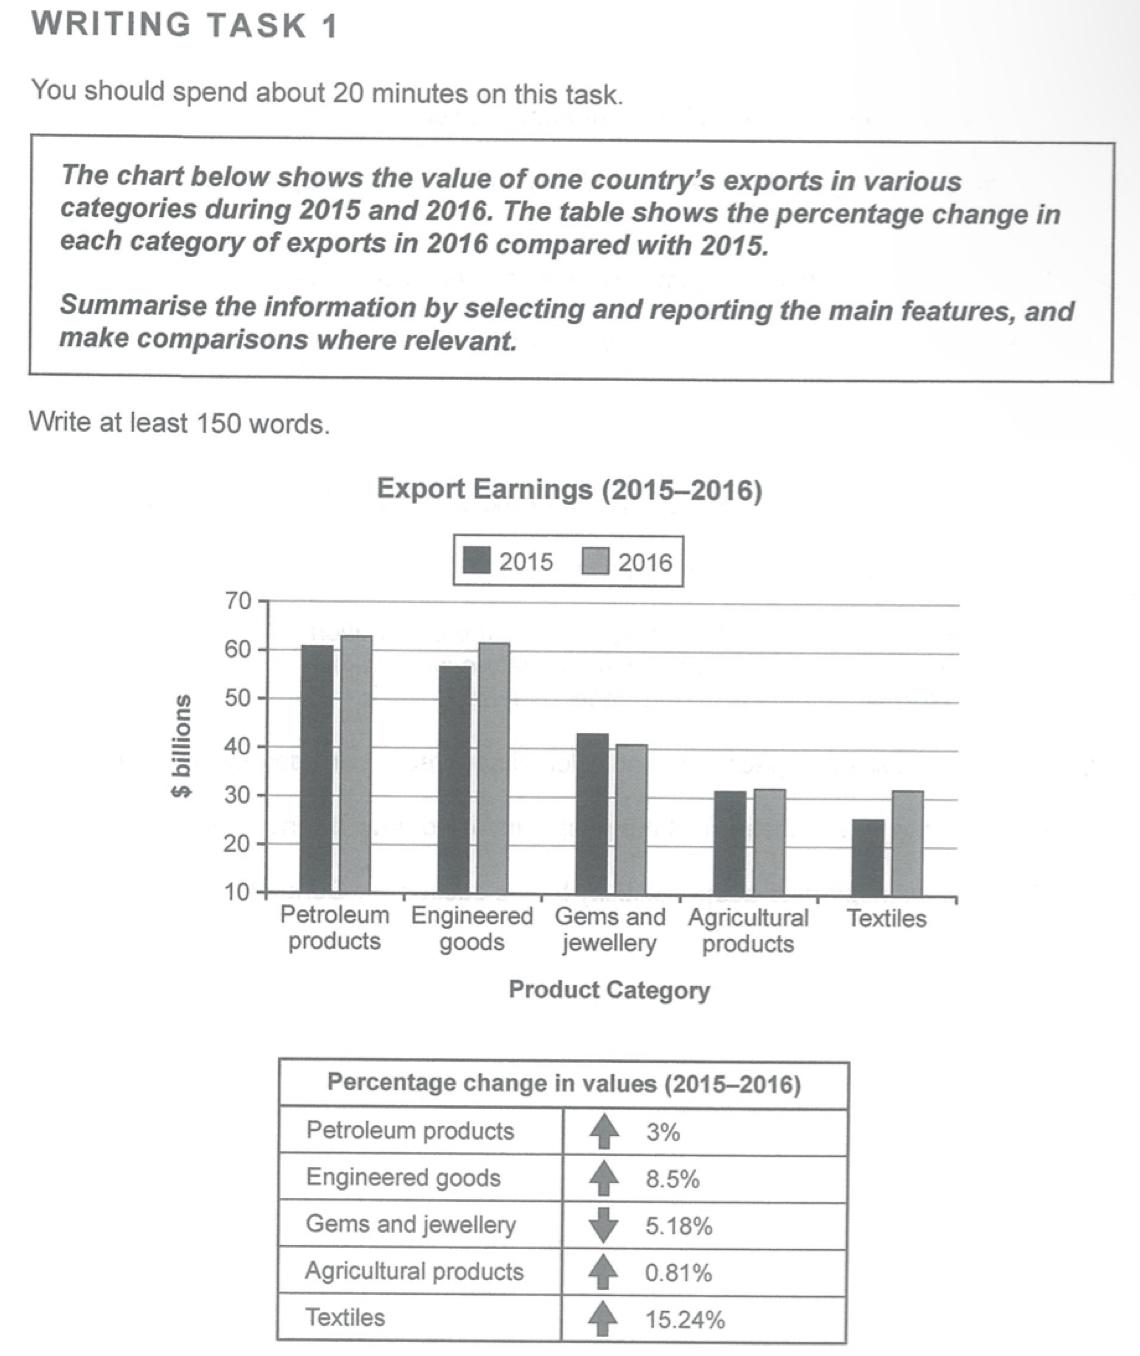


 댓글 0개
댓글 0개


 불편사항 신고