


 인쇄
인쇄


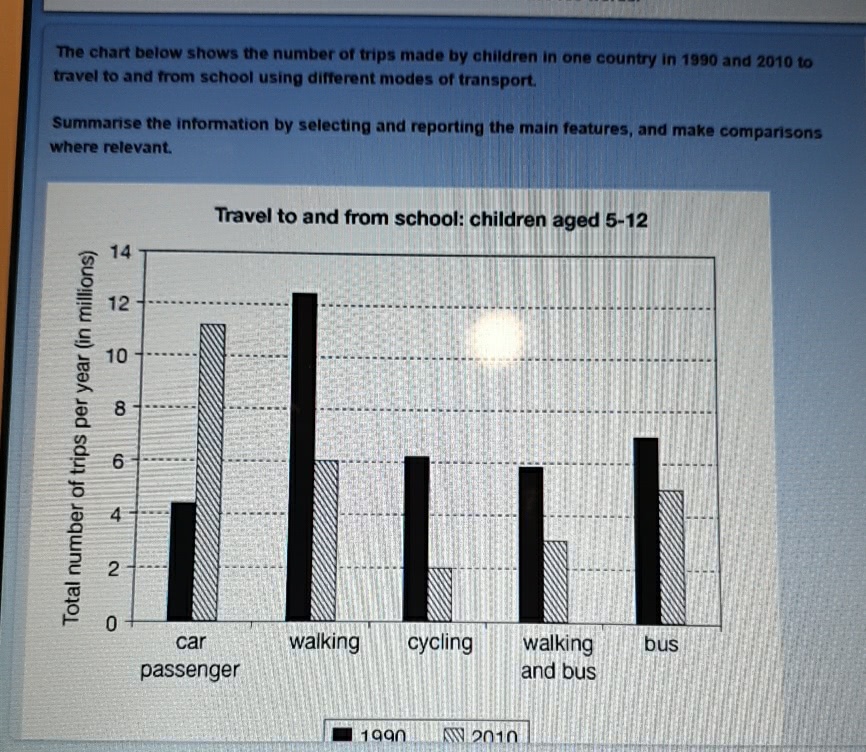
The given bar chart illustrates how many trips are made by children, especially (이게 들어가면 의미가 전혀 달라집니다.) from five to twelve years old, in a certain country by utilising various modes of transport between 1990 and 2010.
Overall, it is clear that the total sum of car passengers and walking during the given period accounted for more than a half of the total. In addition, whereas the statistics of car passengers showed a considerable increase by 2010, the others experienced a fall for the same year.
A more detailed look at the chart reveals that the number of walking, cycling, walking and bus, and bus declined at the end of the year in question. Although the figure of walking in 1990 was the highest than any other figures, it shrunk to almost half in 2010 the previous year. Likewise, the cycling category decreased from 6 million in 1990 to 2 million in 2010.
Moreover, when it comes to the car passengers, it is noticeable that the figure almost doubled in 2010, and it was the only category that increased during the 10-year period.
목표점수 7.0 감사합니다!
수학적 계산을 일체 안하려고 했는데 예를 들어서 '2배로 늘었다 3분의 1정도가 줄었다'
뭐 이런 것도 수학계산인가요? ㅜㅜ
-> 그런 것도 당연히 수학 계산이긴 합니다. 단, '이러한 표에 한해서는' 그런 계산은 해주셔도 괜찮아요. 실제로 아마 이 표의 모범답안 몇 개는 저런 식의 계산을 하는 걸 확인할 수 있을 겁니다.
그러나 문제는 이러한 계산조차 해서는 안 되는 표도 있는데, 학생들이 이를 구분하는 건 쉽지 않아서 저는 아예 그러한 문제를 방지하기 위해 수학을 일체 하지 말아달라고 말씀드리는 것이고요 :)
총평: (6/7/6/7) 6.5
구체적인 수치가 조금 더 들어가면 좋습니다. 특히 마지막 문단에서는 한번 정도 꼭 넣어주셔야 하고요. 그리고 especially와 관련해서는 특히 주의해주세요!
수고하셨습니다 :)

 비밀번호 확인
 댓글 0개
댓글 0개


 불편사항 신고