


 인쇄
인쇄


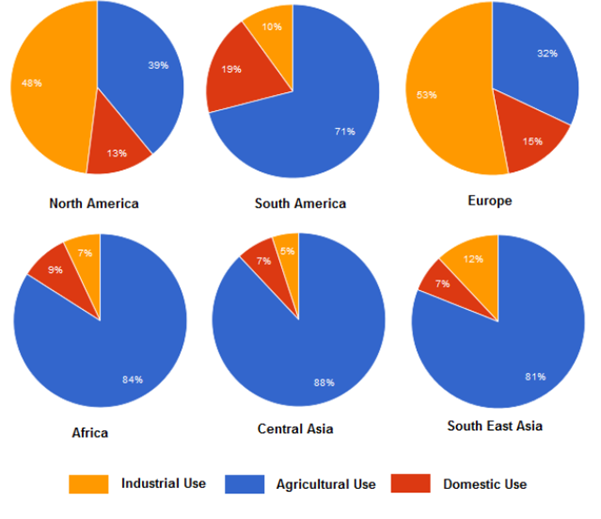
The pie graphs illustrate water consumption percentages of 6 continents, indicating 3 different categories of usage of water.
In general, North America and Europe show shows
the highest consumption rate in industrial use, while the remaining rest of 4 continents consume
relatively huge amounts of water in agriculture.
In terms of industrial use, Europe has the
largest percentage of water consumption, which is above 50% of the total. North America also use water for the same purpose at has very close
to a half of the total though. In South America, Africa and Central Asia, industrial
water consumptions take the lowest percentages. They are small fractions of the
total, compared to agricultural use in these continents. Domestic use is
described to be under 10% in Africa, Central Asia and South East Asia. In these 3
continents, more than 80% of the water is used in agriculture.
--------------------------------------------------------
안녕하세요 이클립스 선생님!
감사합니다.
작성 해주신 피드백을 참고 해서 같은 자료로 다시 작성 해보았습니다.
시간을 재지 않고, 퇴고 해가며 작성 했는데
여전히 대륙의 이름이 많이 들어간 것 같아 -> 대륙 이름은 서론에만 안 들어가면 됩니다. 오히려 그 밑의 문단들에서는 적극 활용해주셔도 돼요!
아쉽습니다. 시간은 한 30분정도 걸렸습니다.
the highest rate
the largest percentage
the lowest percentage
the smallest percentage
위의 네개 표현이 자연스러운지요? 파이에서 가장 큰 부분을 차지한다 라는 표현은 안쓰는것이 좋을까요? ( In Europe, industrial use takes the largest part of the pie. 썼다 지웠습니다.) -> 케바케인데, 일단 이번 표에서는 다 가능합니다. 썼다 지우신 저 문장 역시 가능하고요. 어색한 경우에는 제가 따로 체크해드리겠습니다.
이렇게 저렇게 써보면서,
시간을 재는것만이 능사는 아니라는 것을 깨달았습니다. -맞습니다! 근데 mmjjR님의 경우는 Task1으로만 한정이에요. task2는 그냥 실전처럼 시간 재고 쓰세요!
감사드립니다.
좋은 하루 되세요.
총평: 이전보다 훨씬 낫네요. 일단 구조가 잘 잡힌 점이 제일 긍정적입니다. 아직 세부 분석은 약간의 보완이 필요해보이지만, 여하튼 모든 Task1의 구조는 이렇게 잡으시면 됩니다.
수고하셨습니다 :)

 비밀번호 확인
 댓글 0개
댓글 0개


 불편사항 신고