


 인쇄
인쇄


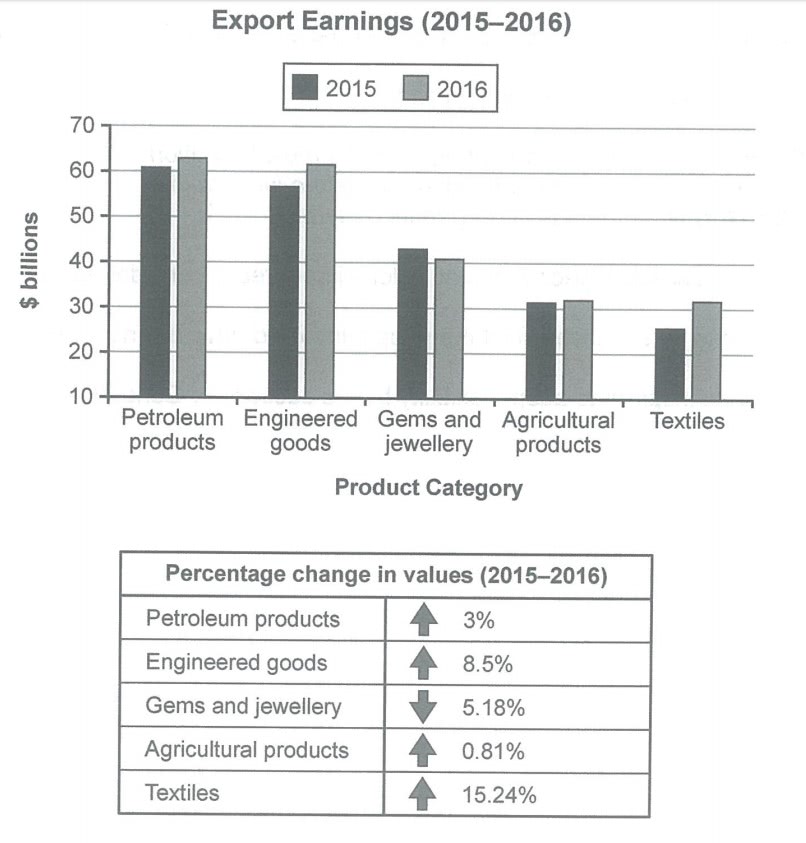
The illustrated bar chart and table outline the changes in export earnings for a country on five categories from 2015 to 2016. As an overall trend, it is clearly apparent that all earnings had sharp improvement except for gems and jewellery, which dropped slightly. The lion share. of earnings was for petroleum and engineered products, whereas textiles and engineered products experienced the biggest bounce in percentage.
The two primary exports were petroleum products, which went from approximately $ 61 billion in 2015 to around $ 63 billion in 2016, and engineered items from $58 billion to $62 billion. That was a short 3% up for petroleum and a far higher increment of 8.5% for engineered goods.
The other three categories had much lower export earnings if compared to these two exports. Gems and jewellery had the only drop in sales of almost $42 billion in 2015 decreasing by 5.8% in 2016. Agricultural items were approximately $31 billion in 2015 and had only a minimum increment of 0.81%. The most noteworthy increment, which was by 15.24%, was for textile, which developed from around $25 billion to over $30 billion.

 댓글 0개
댓글 0개


 불편사항 신고