


 인쇄
인쇄


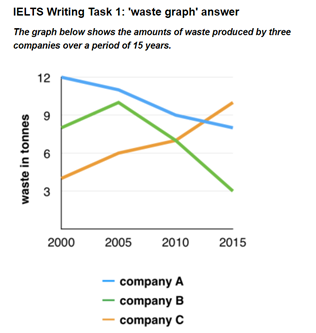
The line graph depicts the information about garbage made by three firms businesses from the year 2000 to 2015. In general, the The graph of company A and B represented downward trend, whereas the figures about company C increased.
In regarding to business A, the company emitted the largest amount of waste from the year 2000 to 2010, accounting for at about 12 in tonnes to around 9 in tonnes. The level of company (여기에 알파벳을 넣어주시고, 또한 문장 자체를 앞과 매끄럽게 이어지게 연결어 등을 추가해야 합니다.) in 2019 was overtook by company C which made waste approximately just under 9 in tonnes. Compared to company A, the graph of company C climbed gradually from about 4 in tonnes in 2000 to around 10 in tonnes in 2015.
As for company B, workers in the business produced the garbage at about 8 in tonnes to 10 in tonnes between the year 2000 and 2005. After in 2005, the figure of the company plummeted to about 3 in tonnes. In 2010, the level of company B and C showed the same level, making up about 7 in tonnes.
총평: (7/6/7/6) 6.5
이번 글은 괜찮았습니다. (왜 아까 task2도 6.5고 이번 task1도 6.5인데 후자만 괜찮은 거냐라는 궁금증이 생기실까봐 말씀드리면, 원래 99% 학생들이 task1을 더 못쓰기 때문에 어느정도 보정이 들어갔다고 보시면 됩니다.)
다양한 문장 구조 시도의 흔적이 보이기 때문에 낮은 확률로 채점관에 따라 7.0까지는 괜찮을 거에요. 자료 자체도 쉬웠던만큼, 분석에는 크게 문제가 없었네요. 대신 문단을 나눌 때의 기준이 명확하지 않다는 점은 주의해주셔야 합니다.
수고하셨습니다 :)

 비밀번호 확인
 댓글 0개
댓글 0개


 불편사항 신고