


 인쇄
인쇄


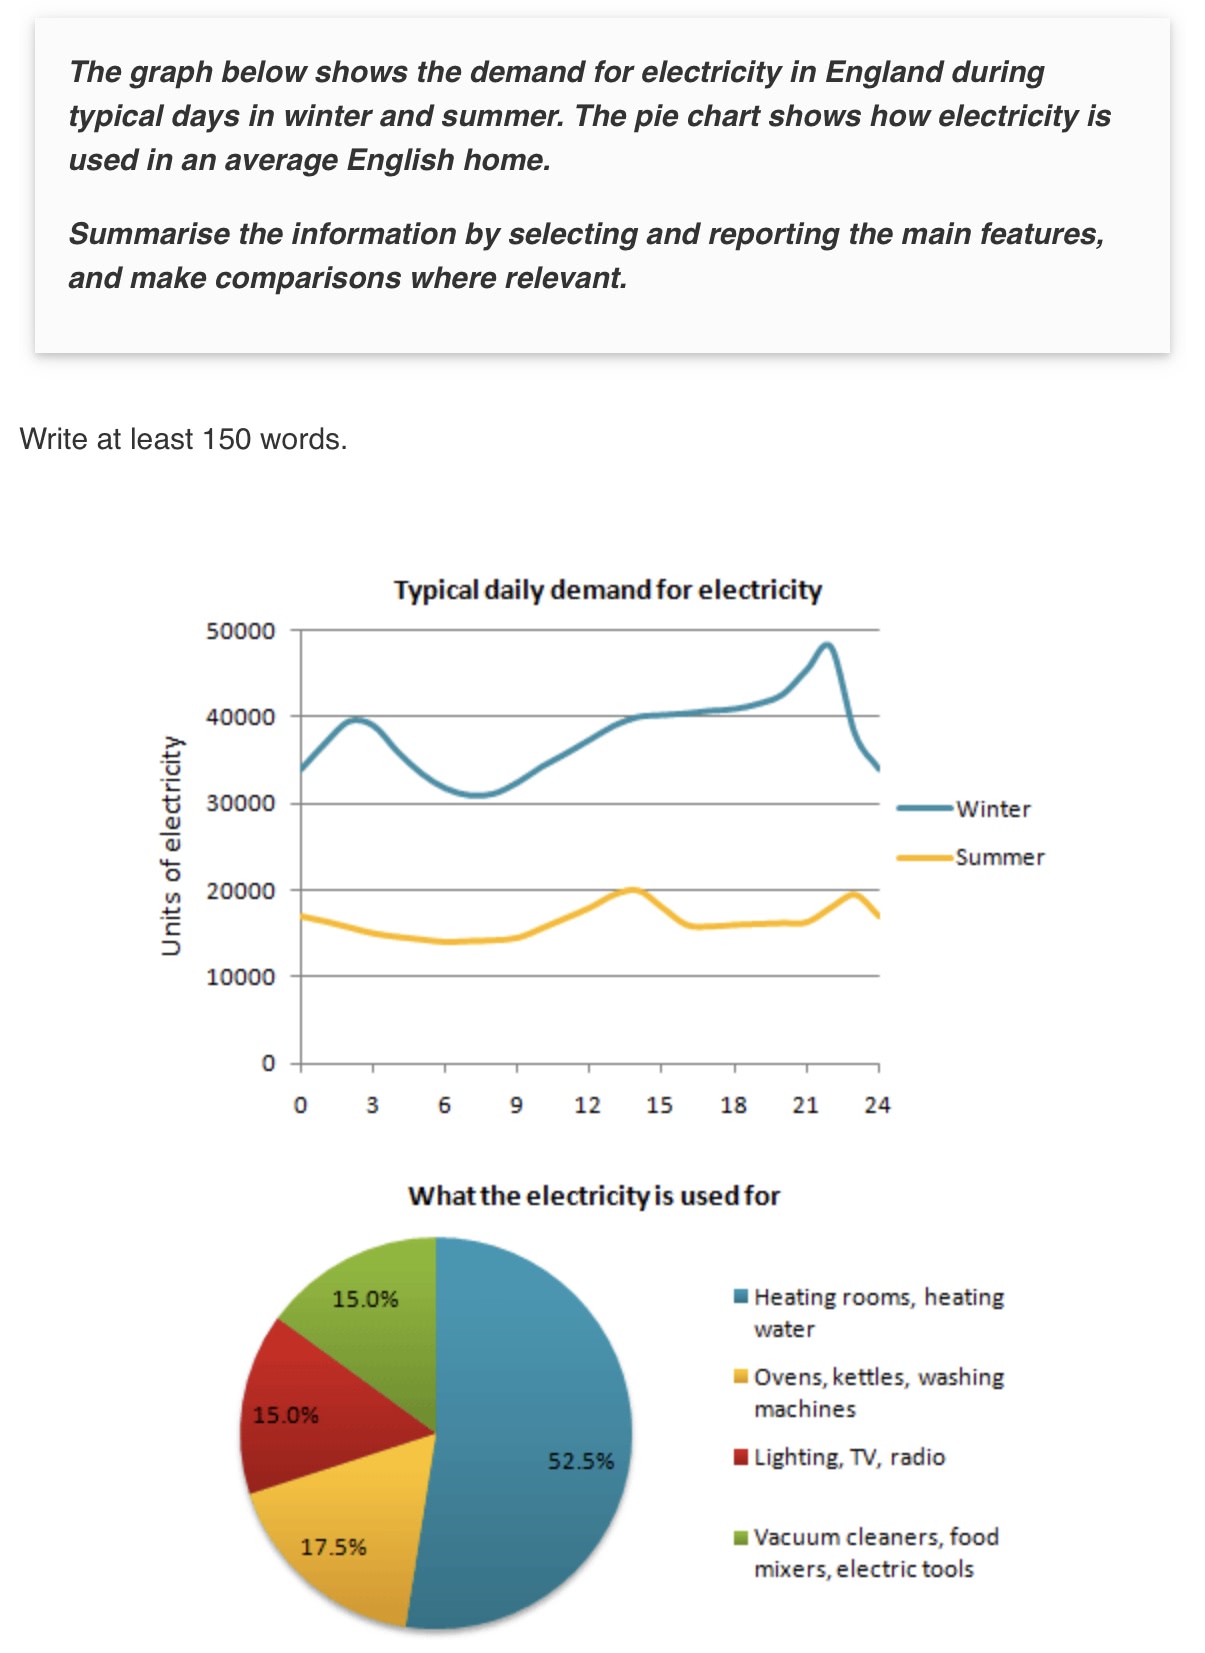
The line graph illustrates the number of units of electricity demanded during a day in winter and summer in England. The pie chart describes what the electricity is used for in English households.
Overall, it is evident that the typical daily demand for electricity is a lot higher in winter than in summer. Moreover, more than half of the electricity is used to heat rooms and water in an average English home.
According to the line graph, the figures start at around 16,000 units in summer times and close to 35,000 units in winter times. The need for electricity in summer is quite steady throughout the day in the summer, reaching its lowest at around 7 am with approximately 13,000 units and highest at around 2-3 pm with close to 20,000 units. On the other hand, the figures in winter times fluctuate during the day and night. Electricity in winter is required least at around 7 am at which units are about 30,000. Following that, the number of demands increases until around 10 pm reaching approximately 48,000 units and decreases afterwards.
Regarding the pie graph, it can be guessed that electricity demands are high in winter because of the need for heating rooms and water. The amount of electricity used to heat rooms and water constitutes more than half of the total usage, which is 52.5%. The electricity used for washing machines and kitchen appliances such as ovens and kettles comes next, with 17.5%. It is followed by 15% of the electricity used for lighting, TV and radio and another 15% of it for vacuum cleaners, food mixers and electric tools.
267 words
22 mins
시험일 11/1, 목표점수 7

 댓글 0개
댓글 0개


 불편사항 신고