Your Answer ▼
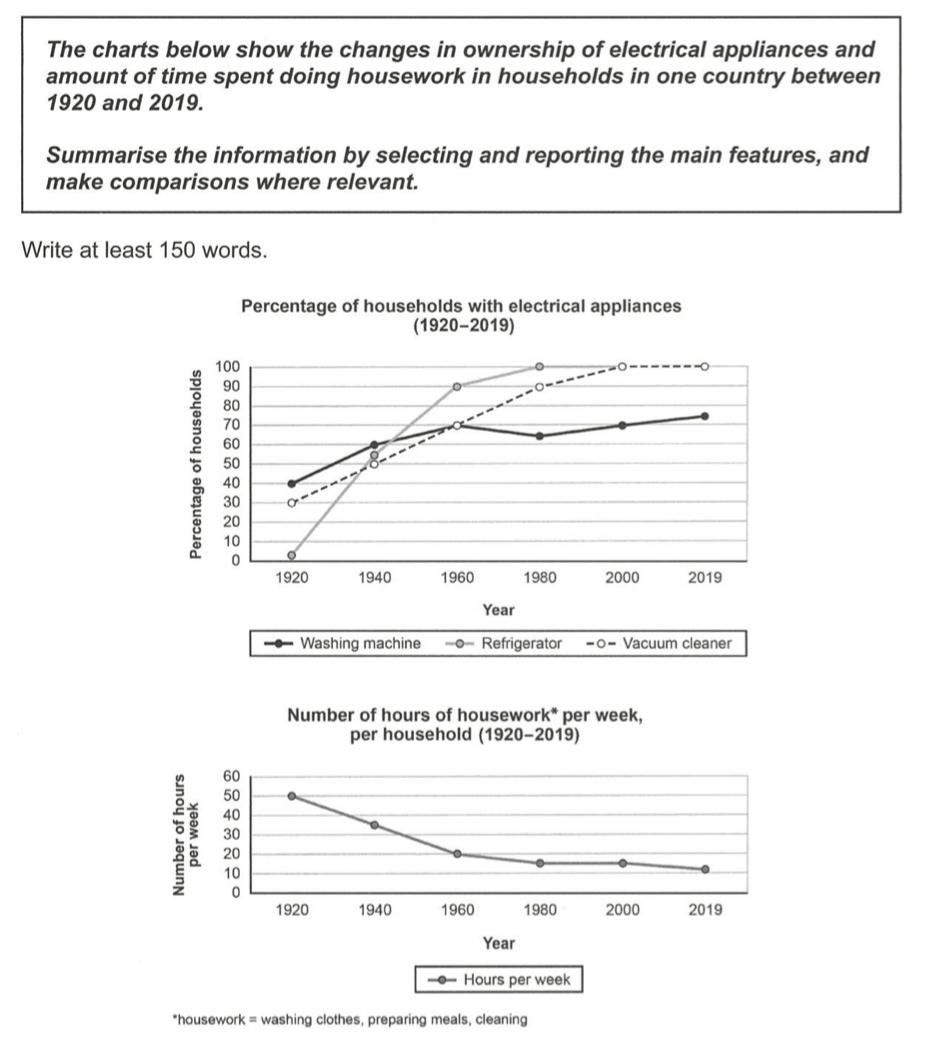
The two line graph demonstrate the proportions of electronic gadgets possession and a weekly spending time on laundry, cooking, and cleaning in a family from 1920 to 2019. Overall, during the survey period, the ratio of the household equipped with electronic appliances remarkably increased whereas houseworking times decreased considerably, showing relatively reverse trends to each other.
In detail, the first graph is composed of three electrical appliances; washing machine, refrigerator, and vacuum cleaner. Among three gadgets, the figure for refrigerator showed the most dramatic change from almost zero to 100%. Also, the proportion of the family with vacuum cleaner also reach 100% in 2000. The figure for washing machine, though fluctuated once, raised rised by approximately 30% from 40% to slightly over 70%.
Furthermore, the second graph gives information about the total time spent on three house chores; laundry, cocking, cleaning. The hours for housework moved in the opposite direction to the proportions of washing machine, refrigerator, and vacuum cleaner; diminishing from 50 to 10 hours in the same research period. |


 인쇄
인쇄


 비밀번호 확인
 댓글 0개
댓글 0개


 불편사항 신고