


 인쇄
인쇄


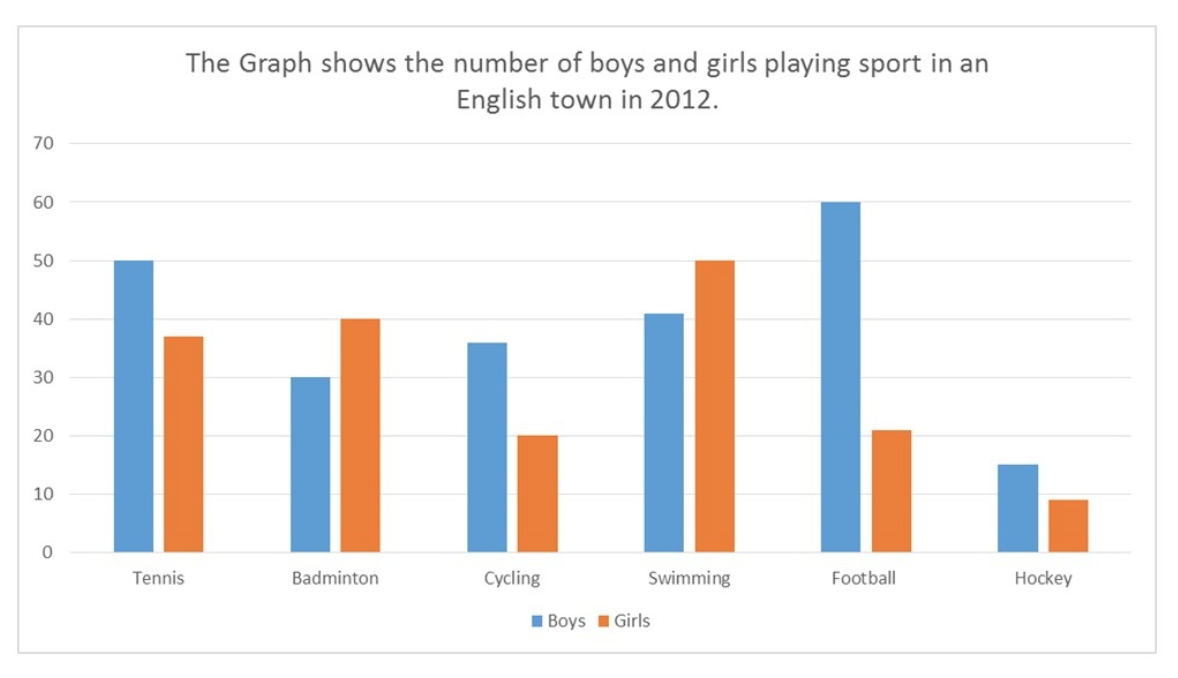
The bar graph illustrates how many children(boys and girls) enjoy playing six different sports(Tennis, Badminton, Cycling, Swimming, Football and Hockey) in an English town in 2012.
Overall, the more number of boys like to play sports than the number of girls in the period given. While the rate (이 표는 비율과 관련이 없습니다.) of football lovers in boy group reveals the highest level, the largest number of girls enjoyed swimming. As for the least number of playing, the least children play hockey in the same year.
There are only two sports that girls more do than boys, Swimming and Badminton (이거랑 뒤에 테니스까지 다 소문자 시작해주시면 됩니다.) which are 50% and 40% respectively, closely followed by Tennis at less than 40%. Four different sports were favoured by boys, in the meanwhile, it is also noticeable that there was the biggest difference between boys and girls in playing football, 60% of boys participate in it which is three times more than girls (slightly over 20%).
Both children genders are not much interested in hockey, around 15% in boys and under 10% in girls. In other the three other categories of badminton, cycling and swimming, boys have quite similar interest numbers interest quite similar rate between 30% and 40%.
총평: (6/7/6/7) 6.5
일단 잘 써주신 편이긴 한데, 단위와 내용 관련해서는 조금 주의해주셔야 합니다. 표에 따로 퍼센트 등의 설명이 추가되어있으면 모를까, 그런 경우가 아니고 달랑 지금의 자료만 주어져있다고 가정하면 이 표는 비율과 아무런 관련이 없기 때문에, 지금처럼 퍼센트를 붙여서는 안 돼요.
표 문제의 상당수가 퍼센트와 관련있는 것은 맞지만, 지금처럼 그렇지 않은 경우도 충분히 있기 때문에 항상 단위 등을 꼼꼼하게 확인해주셔야 합니다.
수고하셨습니다 :)

 비밀번호 확인
 댓글 0개
댓글 0개


 불편사항 신고