


 인쇄
인쇄


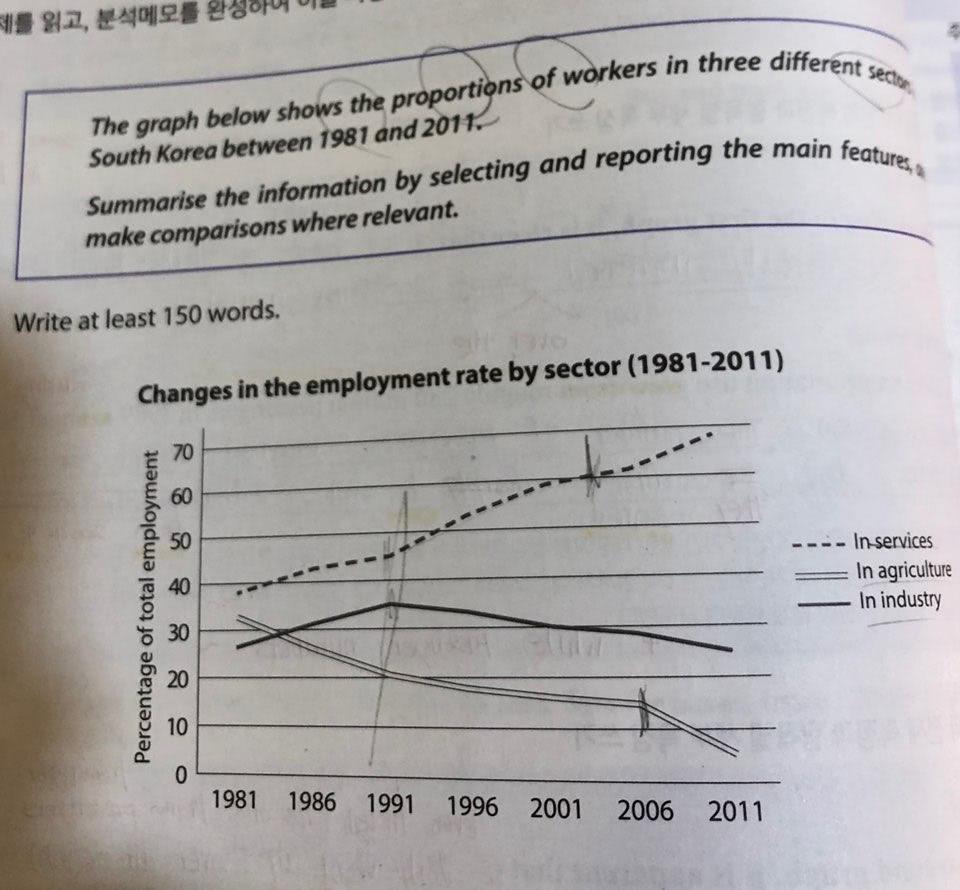
The line graph shows the number of workers in three different types in South Korea from 1981 to 2001.
Overall, it is clear that the percentage of services increased continually between 1981 and 2011, while the percentage of industry rosed until 1991, after that period, it steadily dropped. In the case of agriculture, it has been experienced steadily dropped over the period.
Looking at the graph more closely, one can see that the number of workers in services has been increased since 1981. In contrast, the percentage of agriculture dropped continually until 2011. it almost decreased 24 percent from about 32 percent in 1981 to 8percent by 2011. In industry, the employment figures rosed about 8 percent between first 10 years, but since then, the rates steadily dropped until 2011, hitting a low of 23 percent.

 댓글 0개
댓글 0개


 불편사항 신고