


 인쇄
인쇄


My answer:
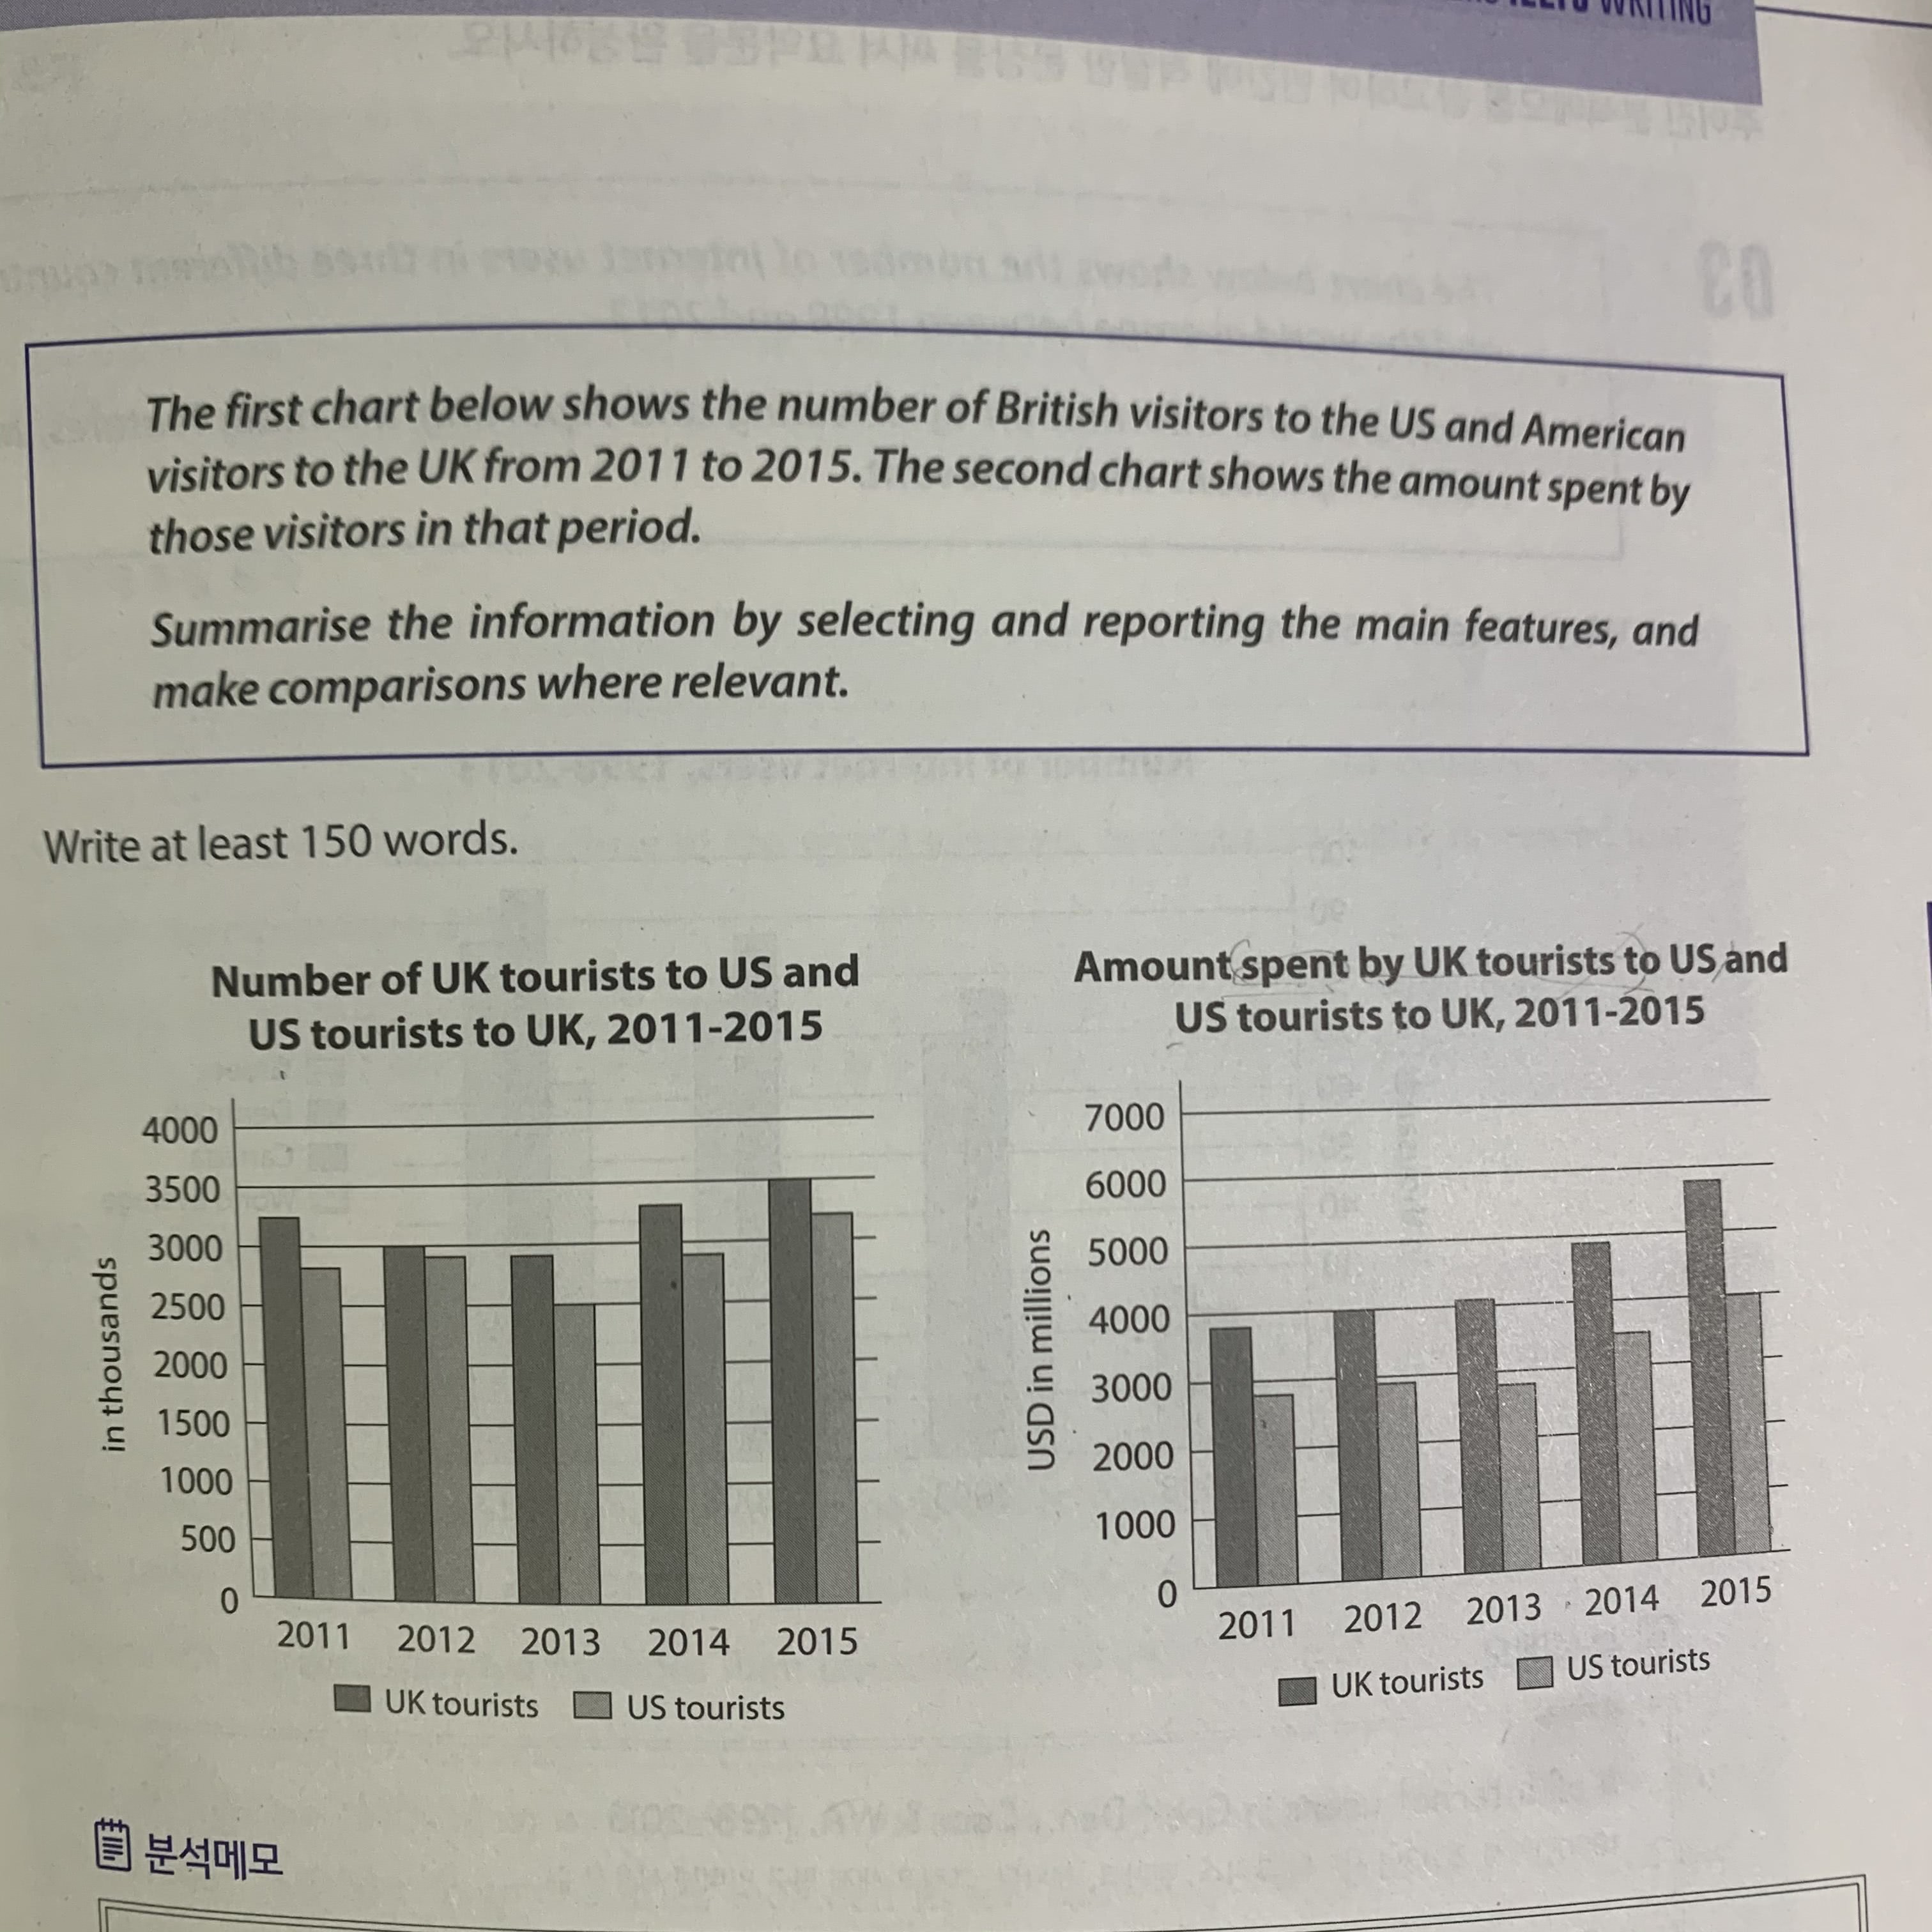
The first bar graph shows that the tourist numbers from the UK to the US and vice-versa from the US to the UK and the second one shows the amount they spent their money in their country they had visited.
(이 위치에 Overview를 넣어주시면 됩니다. 밑에서 더 자세히 말씀드릴게요.)
In the first graph, overall, it is clear that travellers from the UK to the US were much more than travellers from the US to the UK. (여기서 엔터를 따로 치지 않습니다. 파란색에 대해서는 밑에서 말씀드릴게요.))
in In detail, the number of UK tourists to the US declined slightly from 2011 to 2013 then increased gradually to 35,000 thousand which is the highest point over the 5-years period.
Looking at the second graph, it is also clear that the amount of money of the UK tourists was bigger than the amount of money of the US tourists. More specifically, an upward trend was seen in the amount of money of UK tourists until 2015, meanwhile, there were slight shifts in the amount of money of US tourists. US travellers hit a low of under 3,000 million USD in 2013, in the next two years when it peaked at 4,000 million USD in 2015.
총평: (5/6/7/6) 6.0
세부적으로는 크게 문제가 있는 게 아니었어서, 구조만 조금 잡아주시면 지금보다 더 좋은 글이 될 수 있을 겁니다. task1에서는 유형과 관계없이 본격적인 분석에 들어가기 앞서 Overview를 넣는 것이 중요합니다. 이때, 그 내용 자체는 지금 파란색 표시해드린 친구들을 합쳐서 서론 밑으로 옮겨주시면 돼요.
또한, 이렇게 할 경우 특히 첫 번째 표의 세부 분석이 많이 허전하게 될 겁니다. 이를 방지하기 위해 추가 내용을 넣어주세요!
수고하셨습니다 :)

 비밀번호 확인
 댓글 0개
댓글 0개


 불편사항 신고