


 인쇄
인쇄


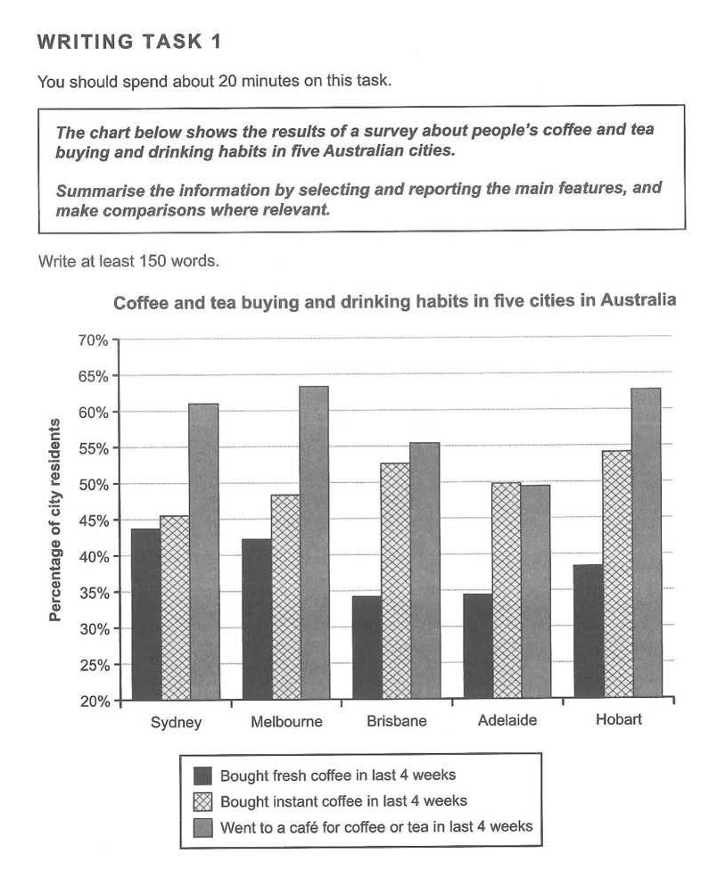
The bar chart provides information related to the percentage of people who have drinking habits of coffee and tea in five specific cities in Australia, with a focus on three different types to purchase the drinks.
In general, it can clearly be seen that the figure of consuming coffee and tea saw a gradual increase and the popularity of fresh coffee is the lowest in all five locations.
Initially, the great number of individauls who took fresh coffee away in last 4 weeks are living in Sydney. (just under 45%). However, the lowest proportion of fresh coffee consumtion during 4 weeks standed in approximately 34% in Brisbane. In terms of the habit buying instant coffee in last 4 weeks, about 55% of buyers were in Hobart and only around 46% of them resided in Sydney.
As for the higest percentage of consumers who preferred to visit cafes for coffee or tea, accounted for about 64% in Melbourne. Conversely, the least of them were in Adelaide (nearly 50%).
(166) 시험이 약 10일 남았네요 .. 제일 흔히 나오는 유형으로 준비하고 싶은데 어느 유형을 중심으로 하는 게 좋을까요? 매일 들르도록 노력하겠습니다..!!

 댓글 0개
댓글 0개


 불편사항 신고