


 인쇄
인쇄


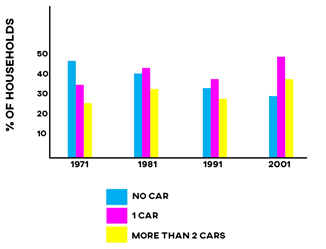
The bar chart shows the percentage of households with cars in a European country between 1971 and 2001.
This bar chart illustrates the proportion of households with vehicles in a European country from 1971 to 2001.
Overall, it is clear that the percentage of no car decreased from 1971 to 2001. Incidentally, the trajectory of one car and more than 2 cars fluctuated for those years.
Regarding to category of no car, the percentage started at just under 50 in 1971, after which, the figure went down continuously to about 30 in 2001. On the other hand, the category of more than 2 cars took place the smallest proportion, which was over 20 in 1971. In 1981, the percentage of more than two cars climbed up a little to approximately 30 however, there was fluctuation from 1991 and 2001.
In regard to 1 car, the proportion of one car surpassed that of no car in 1981, which consisted of 40. In 2001, the highest percentage was accounted by one car among all categories, and the specific figure was around 50.

 댓글 0개
댓글 0개


 불편사항 신고