


 인쇄
인쇄


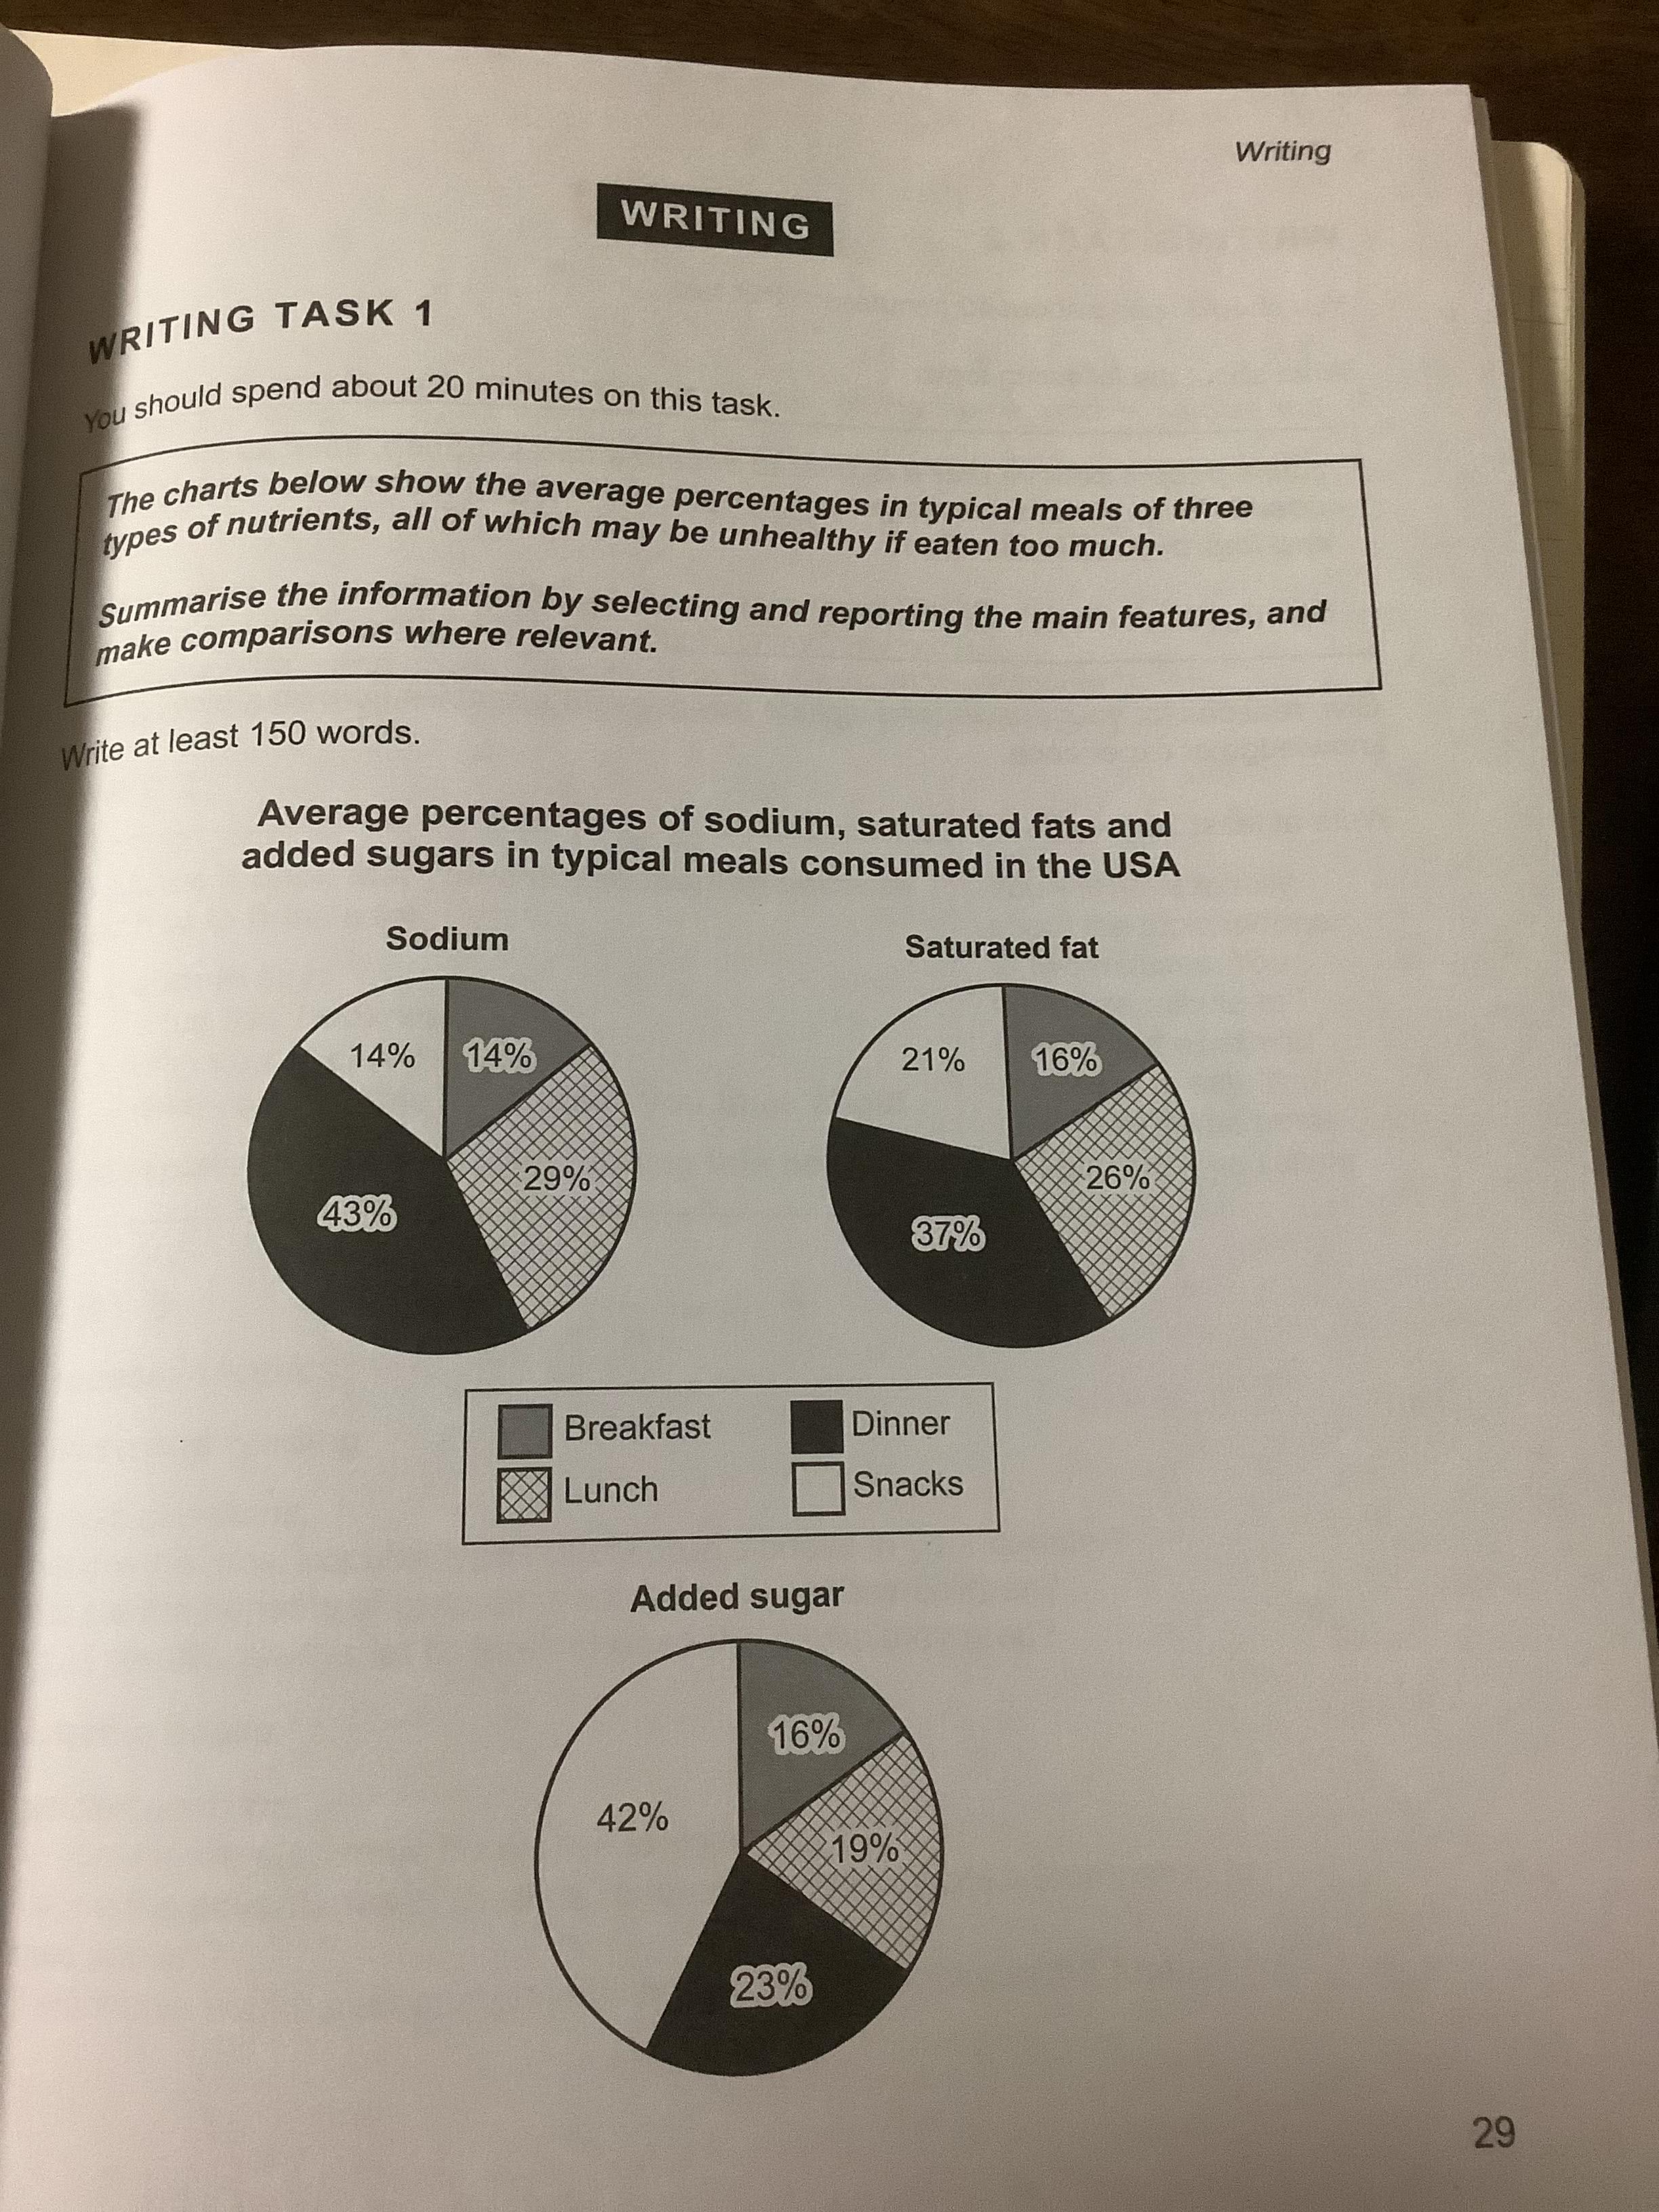
The three given pie charts show the percentage fo nutrients, which are sodium, saturated fat and adding sugar (항목은 따로 나열하지 않습니다. 이거라도 써서 150자를 넘겨야 한다면 써야겠지만...채점관한테는 분량 채우기로만 보일 겁니다. 딱히 점수에 있어 도움은 안 돼요.) consumed in typical meals in the USA. The overtake of Overtaking of these three nutrients is unhealthy.
The most notable feature among the given charts is that the proportions of sodium and saturated fat during dinner. It takes the highest portion of it which is 43% and 37% respectively. In contrast, added sugar is consumed relatively evenly in breakfast lunch and dinner evenly in meals under 25%, while snacks take the biggest part which is 42%.
On the other hand, the rate of three nutrients in lunch is quite similar from 19% to 29%, also proportions of breakfast are more evenly distributed (14% and 16%, respectively).
All in all, the diagrams above show the proportions of consumption of three nutrients which are unhealthy if eaten too much in typical meals. In general, dinner Dinner has the highest percentage in sodium and saturated fat while in added sugar, snacks’ proportion is the highest. (첫 번째 줄은 서론에서 했던 말입니다. 고로 분량 채우기에 불과하며, 두 번째 줄의 경우 Overview에 해당하므로 서론 밑으로 옮겨주시면 되고요. Overview는 항상 서론 밑에 간다고 보시면 되겠습니다.)
총평: (6/6/6/6) 6.0
task2와는 달리 task1은 결론을 내기 위해 존재하는 글이 아니고, 성격이 아예 다르므로 주의해주셔야 합니다. 고로 결론을 적지 마시고 대신 서론 밑에 Overview를 넣어주시면 되겠습니다. 또한 지난 글에서도 질문해주셨고, 이번 글의 경우도 분량을 채우는데에 어려움을 겪으셨는데, 분량 관해서는 모범답안을 보시고, 내 글에는 없었는데 해당 답안에서는 이러한 세부적인 분석을 했구나~등을 적극적으로 파악해주셔야 합니다.
수고하셨습니다 :)

 비밀번호 확인
 댓글 0개
댓글 0개


 불편사항 신고