


 인쇄
인쇄


ㅊ
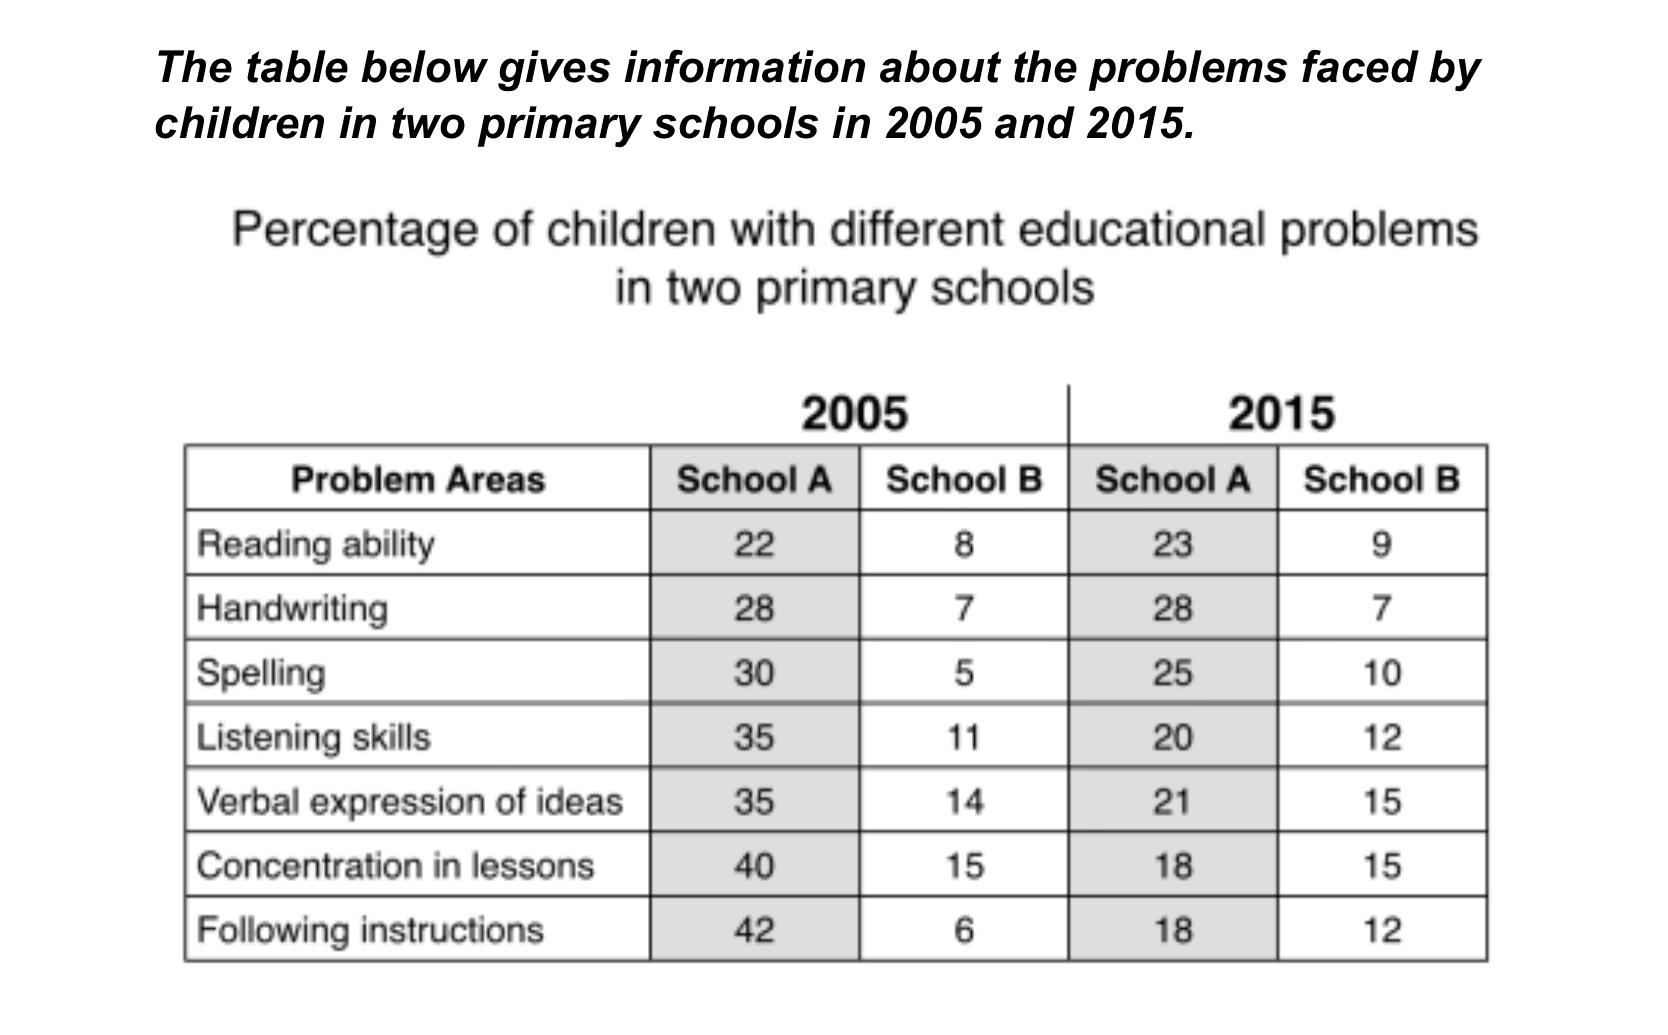
The given table chart compares with students who study in two different primary school suffered educational problems in the years 2005 and 2015.
On the whole, it is evident school A’ students experienced more difficulties in all parts in their educations than B’ one in the period shown, while school B’ students who underwent problems increased than in the past.
Looking at the table more closely, one can see that almost problem areas decreased in primary school A except reading ability and handwriting after a decade from 2005. The handwriting figure was the same in both years, at 28 percent. The percentage of following instruction in school A was the highest figure at 42 per cent, whereas its measure declined significantly at 18 percent.
As for school B, handwriting was the most problem for children, and this figure was 28 percent but this subject was overcame, and changed the lowest difficulty area, at only 7 percent after ten years. In 2015, pupils in school B underwent the hardest in verbal expression of idea and concentration in lessons as the same figure at 15 percent.

 댓글 0개
댓글 0개


 불편사항 신고