


 인쇄
인쇄


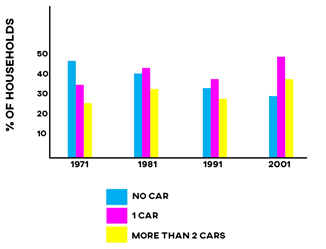
The bar chart shows the percentage of households with cars in a European country between 1971 and 2001.
This bar chart illustrates the proportion of households with vehicles in a European country from 1971 to 2001.
Overall, it is clear that the percentage of households that did not have a no car decreased from 1971 to 2001. Incidentally, the trajectory (이런 단어 안 쓰셔도 되고, 오히려 너무 과하니까, 이런 단어 쓰기보다는 앞에서 제가 수정해드린대로 더 정확하게 풀어쓰는 걸 우선히해주세요!) of one car and more than 2 cars fluctuated for those years.
Regarding to category of no car, the percentage started at just under 50% (여기 포함 싹 다 붙여주셔야 합니다.) in 1971, after which, the figure went down continuously to about 30 in 2001. On the other hand, the category of more than 2 cars took place the smallest proportion, which was over 20 in 1971. In 1981, the percentage of more than two cars climbed up a little to approximately 30 however, there was a fluctuation from 1991 and 2001.
In regard to households with a single 1 car, the proportion of one car surpassed that of no car in 1981, which consisted of 40. In 2001, the highest percentage was accounted by one car among all categories, and the specific figure was around 50.
총평: (7/6/6/6) 6.5
화잍님도 바로 밑의 ckang20님과 거의 비슷한 상황이라고 보시면 됩니다. 두 학생 모두 task2는 지금 당장 7.0을 받으실 거지만, 냉정히 보면 task1은 부족한 상황이에요.
문장들을 죄다 the ~ of ~로만 구성하지 마시고, 모범답안을 분석하면서 최대한 다양한 구조를 활용해주세요. 단순히 percentage를 proportion으로 바꾼다고 해결되는 게 아닙니다.
수고하셨습니다 :)

 비밀번호 확인
 댓글 0개
댓글 0개


 불편사항 신고