


 인쇄
인쇄


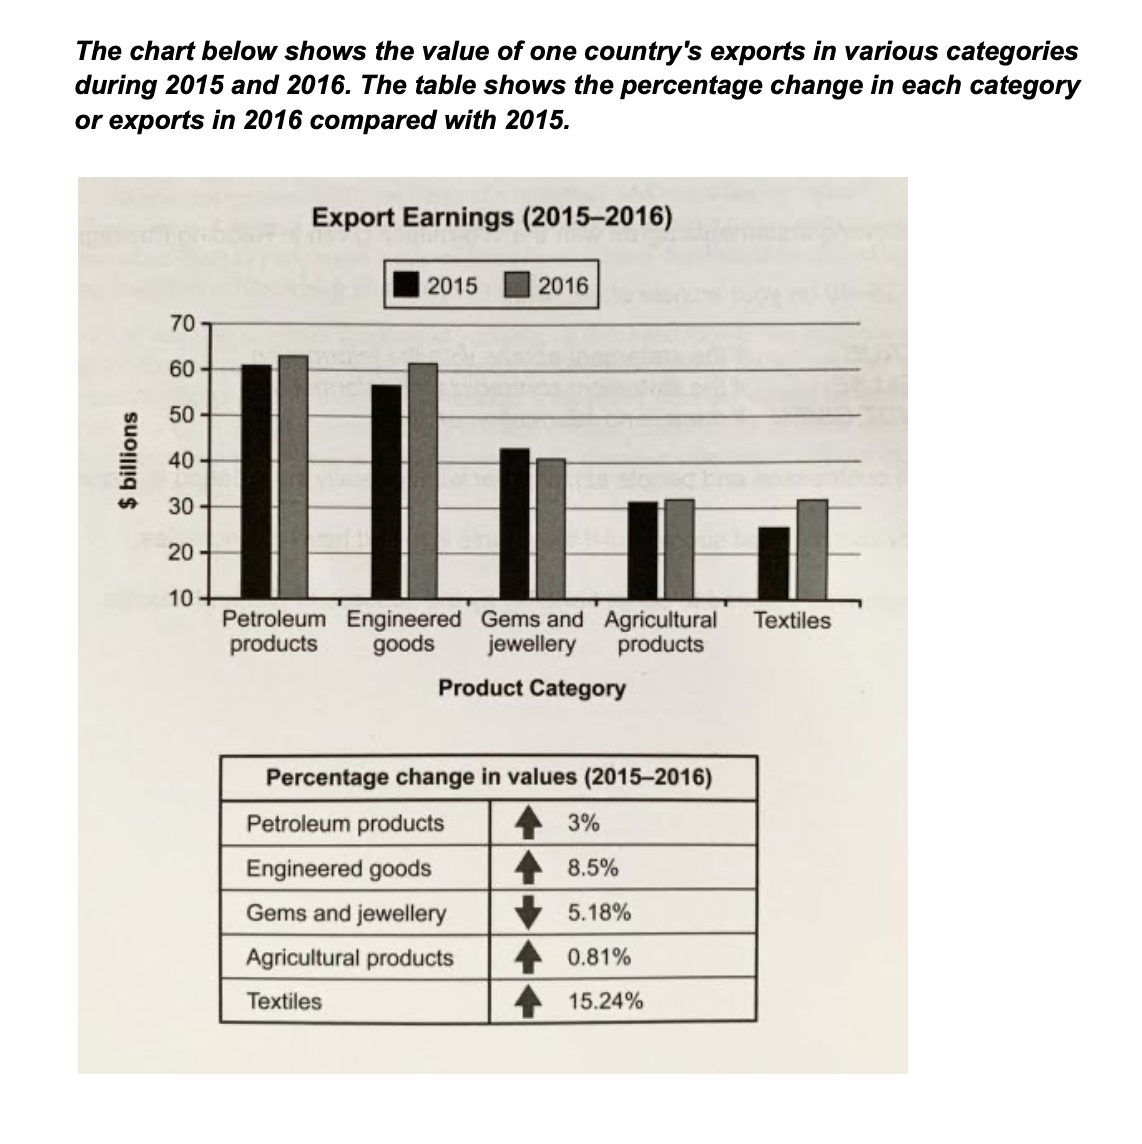
These charts illustrate how one country’s exports are valued with some products in 2015 and 2016 each.
Overall, the proportions of export with two products which are Petroleum and engineered goods took half over than the other products exported in 2015 and 2016 each. With regard to the other figure, the percentage of agricultural products was changed to upward compared with other products which are descended.
In further detail, the agricultural goods remained to same export earnings with 30 billions in two periods which are 2015 and 2016. The Textiles, on the other hand, was exported with 25 billions and this export earning was up to 30 billions in 2016. With this positive trend, in the other figure, it is shown that the highest rise was the products of textiles with growth of 15.24 percent which is nearly doubled from petroleum products.
총 142단어
시간 20분

 댓글 0개
댓글 0개


 불편사항 신고