


 인쇄
인쇄


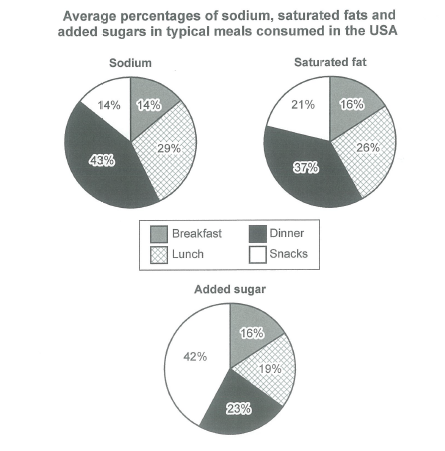
These three pie charts demonstrate the average proportions of sodium, saturated fat, and added sugar consumed in the USA and show when American people consume those three types of nutrients.
Overall, the percentages of sodium and saturated fat were highest in dinner time. In the mean time, most of the USA citizens consume the added sugar when they eat snacks. In addition, anyone can see that the percentages of ‘lunch’ were least in all three types of nutrients.
With regards to intaking sodium and saturated fat, the percentages of ‘dinner’ were highest, which account for 43% and 37% each, follow by ‘lunch’. The proportions of ‘lunch’ and ‘breakfast’ were same in intake of sodium at 14%.
In the case of the consuming of added sugar, it has the highest quantity in snacks, which consists of 42% follow by dinner. Looking at the charts more closely, the percentages of added sugar and saturated fast in breakfast were same at 16%.
~~~~~~~~~~~~~~~~~~~~~~~~~~~~~~~~~~~~~~~~~~~~~~~~~~~~~~~~~~~~~~~~~~~~~~~~~~
선생님 감사합니다. 목표는 7.0 입니다..
따끔한 조언 부탁드립니다

 댓글 0개
댓글 0개


 불편사항 신고