


 인쇄
인쇄


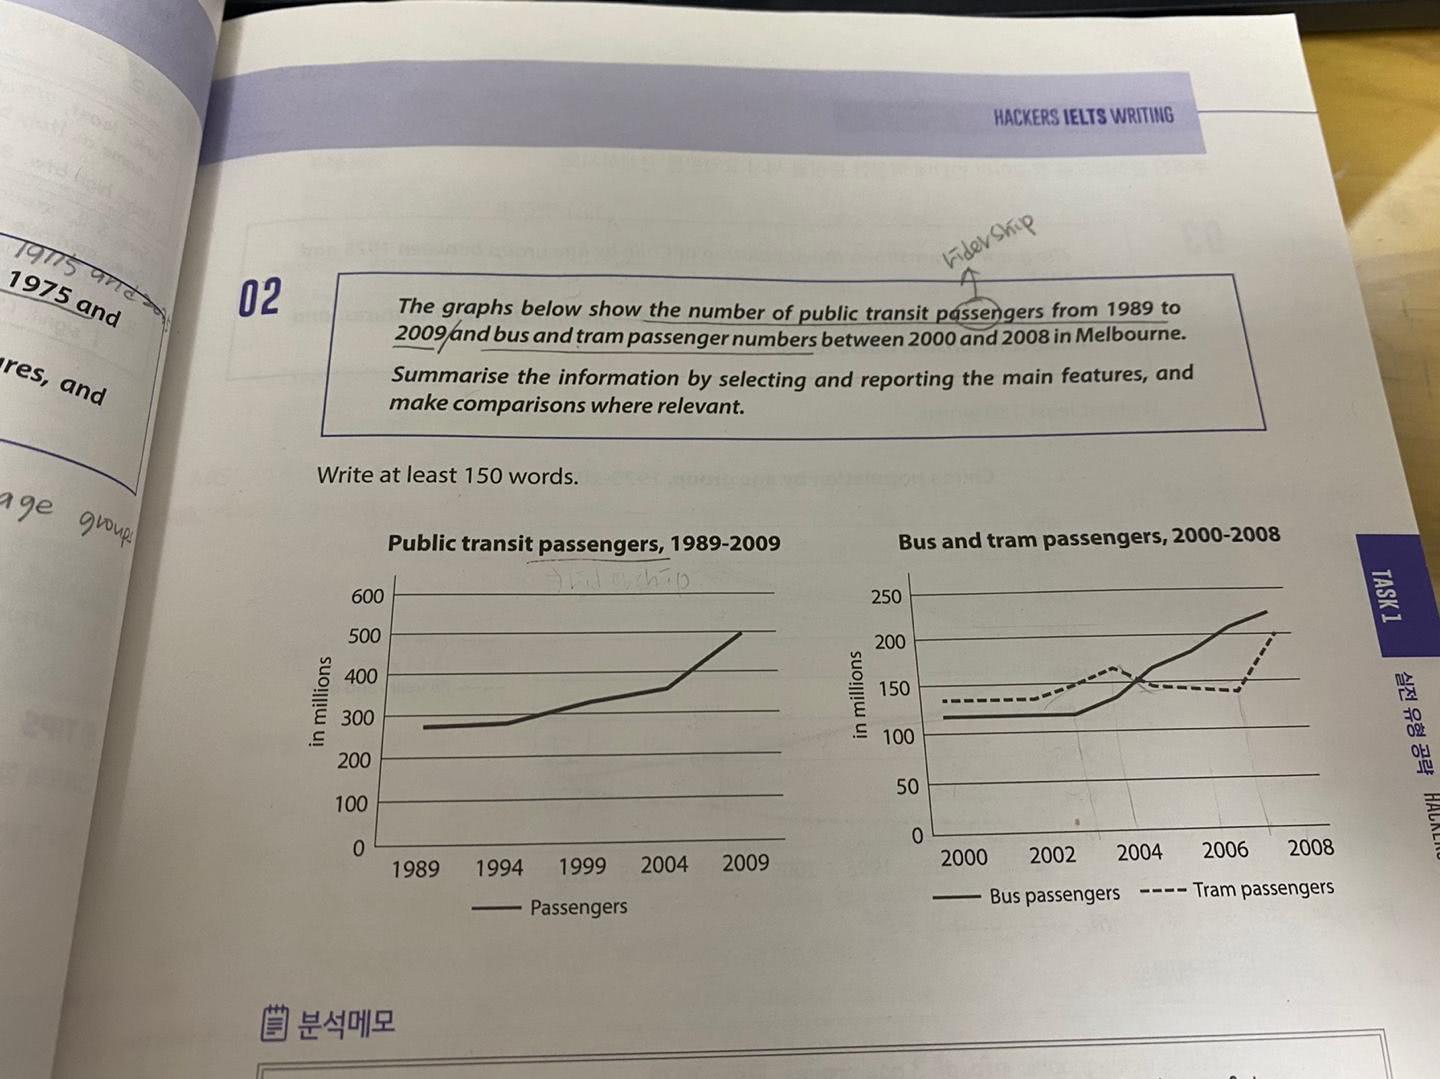
The first graph illustrates the ridership number for public transit between 1989 and 2009, and the second graph shows the number of the bus and tram passenger from 2000 and 2008 in Melbourne.
Overall, it is clear that the number of the public transit passenger in Melbourne significantly increased over the 20 year period. While the bus and tram passenger numbers both climbed over the 8 years, there were the highest growth in the bus.
According to the first graph, public transportation users remained almost constant at about 280 million from 1989 to 1994. After 1994, this figure had slowly increased by 2014, which rose to approximately 350 million, and it dramatically soared to 500 million during the last 5 year period.
On the other hand, in second graph, the total number of the bus user were equal to more than 100 million for the three years. However, it significantly increased by 2008, reaching about 230million. This figure almost doubled compared to 2002. While there were no change in the number of the tram passengers from 2000 to 2002, during the two year period, this figure generally rose to over 150 million, and then it had slowly declined to under 150 million by 2007. However, in the last year, the tram passenger numbers reached 200 million, which was smaller than the number of the bus passenger.
글자수: 226자 / 시간 : 25분 / 목표점수: 6.0
오타 확인하고 내용 확인하다보니 시간이 또 초과했습니다ㅠㅠ
시간 초과 하지 않는선에서 잘 써보겠습니다ㅠㅠ

 댓글 0개
댓글 0개


 불편사항 신고