


 인쇄
인쇄


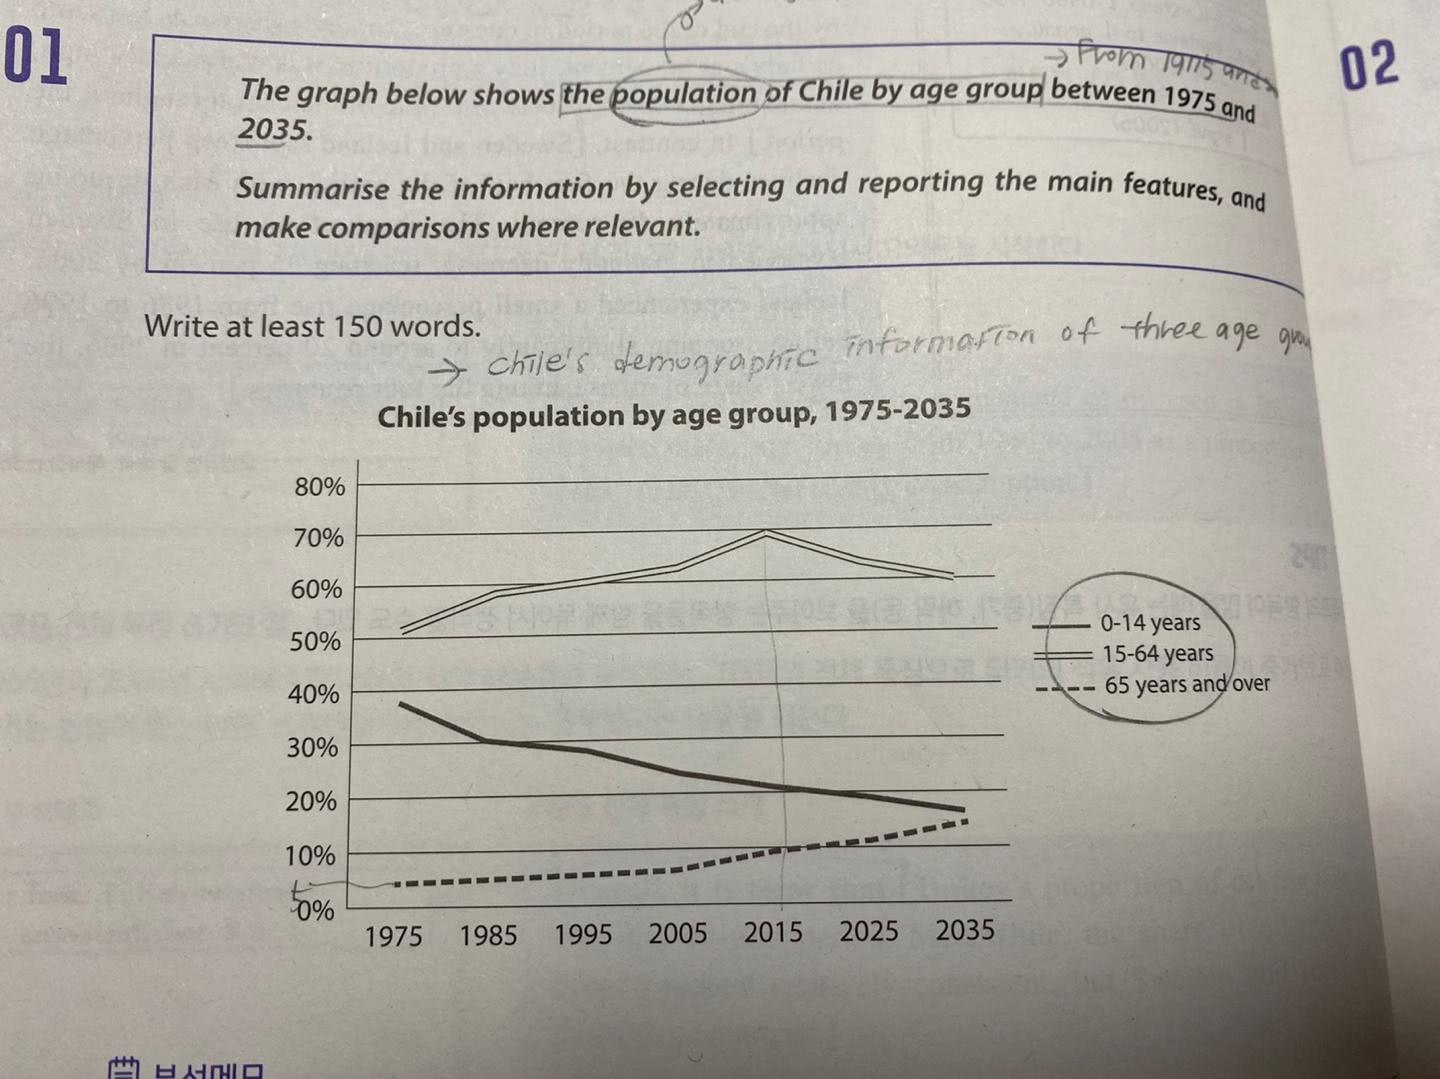
The graph illustrates Chile's demographic information of three age groups from 1975 to 2035.
Looking at the chart more closely, one can see that, people from 15 to 64 year olds accounted for about 50 percent in 2015, and this figure had significantly increased to 70 percent by 2015. However, it is expected that it will decline to approximately 60 percent between 2015 to 2035. In contrast, Although the oldest age group consisted of people 65 years and over make up the smallest rate of population among all age groups, it is predicted to triple from around 5 percent in 1975 to abount 15 percent by 2035. Finally, The yougest age people consistently decreased, it went down from under 40 percent to nearly 20 percent between 1975 and 2015 and is projected to continually drop by 2035.
Overall, it is clear that the population proportion of 15 to 62 years has consistently been the largest and is expected to remain in the future. Also, it is evident taht the oldest group will likely to rise than the first year in the question, the youngest age group is projected to continue shrink by 2035.
글자수 : 195 , 시간: 25분 , 목표점수: 6,0
상세한 첨삭 덕분에 라이팅 공부에 정말 많은 도움을 받고 있습니다:)
정말 감사합니다!!!
이번 TASK1 첨삭 확인 부탁드리겠습니다:)

 댓글 0개
댓글 0개


 불편사항 신고