


 인쇄
인쇄


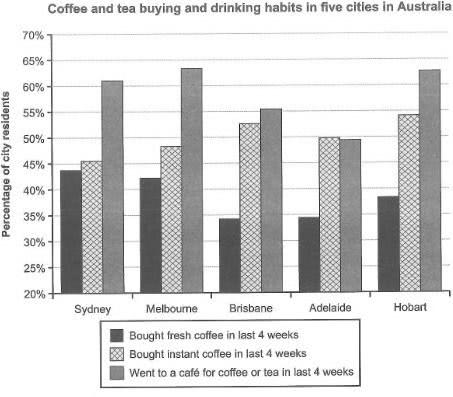
The graph indicates the information about how Australian who lives in five
different cities deal with drinking and purchasing the coffee and tea.
Overall, the percentage of visiting a cafe for coffee or tea in last 4
weeks in Melbourne was the highest, while number of people in Sydney and
Hobart who bought fresh coffee and instant coffee in last 4 weeks showed the
highest.
More specifically turning to the chart, around over 60% of people in Melbourne have visited to a cafe for coffee or tea in one month while only just under 50% of citizens in Adelaide did that visiting. In addition, the percentage of purchasing instant coffee in Adelaide has quite similar trend by reaching almost 50%, whereas the rate of fresh coffee purchase only showed about at 35%. People in Hobart also enjoyed visiting cafe to have coffee or tea by recording just over 60%, however, the number of fresh coffee and instant coffee were bought by people with approximately 37% and 55% respectively. Even though the rate of buying fresh coffee in Brisbane and Adelaide were the lowest among the five countries, their preference of instant coffee were not that lower than other cities, by reaching over 50% in both cities.
시간 25분 ㅜㅜ
205 words
시험보러 가기 전에 마지막으로 올려보려고 부리나케 써봤어요. 이런 표는 분석하느라 시간이 너무 많이 걸리네요
연습이 부족했던걸까요 ㅠㅠ 이번 시험이 끝나도 아마 또 이 게시판에 첨삭받으러 와야할듯하네요 ㅋㅋ ㅠㅠ

 댓글 0개
댓글 0개


 불편사항 신고