


 인쇄
인쇄


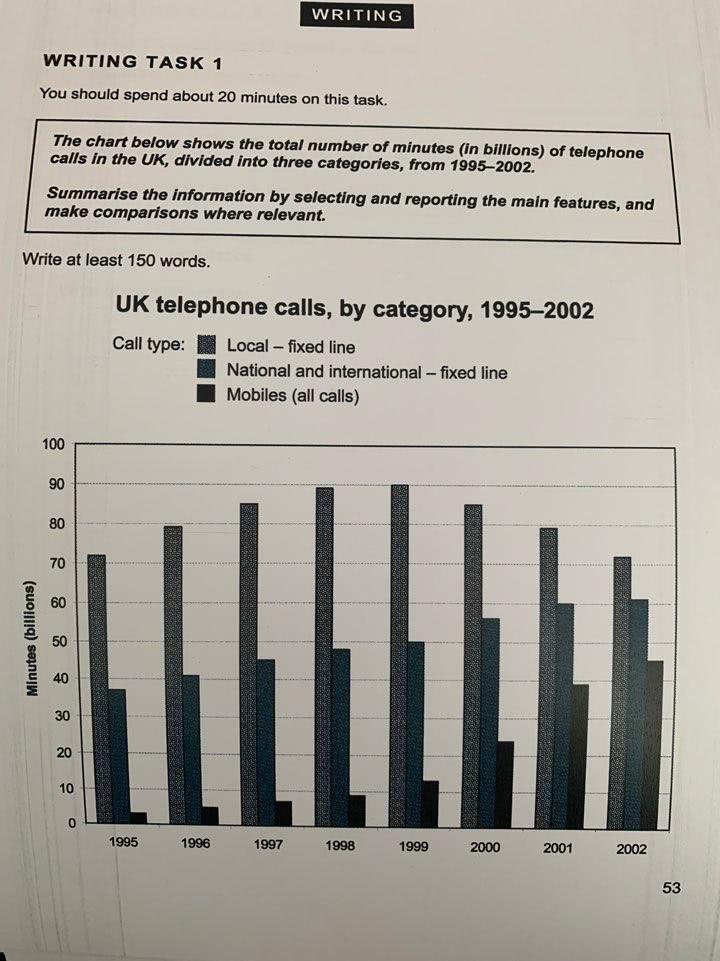
This bar graph shows UK telephone calls made by 3 calling types between 1995 to 2002. Overall, call which was made by local fixed line rated highest minutes in all years, followed by national and international fixed line, and all calls for mobile.
To look at the graph more closely, in 1995, local line was just above 70 minutes, and it steadily increased to 90 minutes until 1999. After 2000, it diminished annually, locating back to where it started. In case of national and international fixed line, it was around 38 minutes back in 1995. However it rose continuously until 2002, having a little over than 60 minutes. For mobiles, its amount was nearly at 5 minutes in 1995. Mobile usages had started to rise since then, and jumped over 10 minutes in 1999. From year 2000 to 2001, the quantity of mobile usage was almost doubled. In 2002 it stopped at 45 minutes, which was almost 9 times higher than year 1995.
163 words
18min
첨삭부탁드리겠습니다 선생님!!
매번 감사드립니다ㅠㅠ

 댓글 0개
댓글 0개


 불편사항 신고