


 인쇄
인쇄


The chart below shows the percentage of househods in owned and rented accommodation in England and Wales between 1918 and 2011.
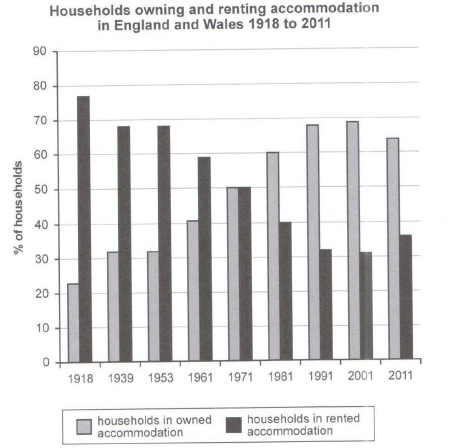
The given bar chart illustrate information on the household figure for owned and rented accommodation in England and Wales from 1918 to 2011.
Overall, it is clear that the two sectors depicted the opposite trend, the percentage of owned accommodation was an upward trend, whereas that of rented accommodation showed downward trend, over the given period.
In detail, the ratio of owned accommodation which started at merely about 23% began to show increase since 1939 to 32%. By 1971, people who populated in England and Wales more and more became owners of accommodation, the percentage accounted for 50%. After 10 years, the percentage recorded a tremendous increase by 10% points. The rate reached a top of close to 70% in 2001.
Moving to the rate of rented accommodation started at 76 approximately which was the highest figure in 1918. Between 1939 and 1953, the figure experienced decreased sharply to 68%. The categories showed steady reduced by 9% for 48 years. In the final year, the percentage made up 37%, the lowest figure.

 댓글 0개
댓글 0개


 불편사항 신고