


 인쇄
인쇄


The graph below shows the number of applicants from four different countries in a UK university between 1999 and 2003. Summarize the information by selecting and reporting the main functions, and compare where appropriate.
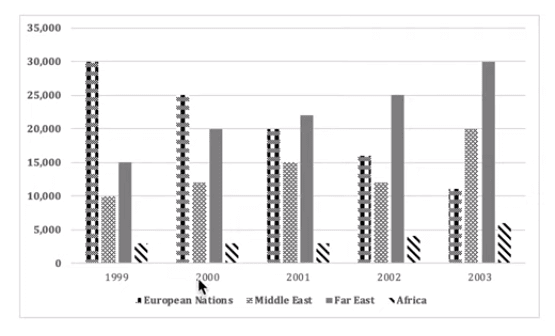
The bar graph depicts the number of people
who applied for a university in the UK from 1999 to 2003. The applicants
consist of four continents like Europe, Middle East, Far East, and Africa.
Overall, except for European applicants, the number of applicants who are from
different three continents increased between 1999 and 2003.
Firstly, it is easily seen that the number
of applicants from European nations gradually declined throughout the period.
The figure was from 30,000 in 1999 to about 11,000 in 2003. In contrast, the
number of people who are from the Far East steadily increased during the
period. The figure was from 15,000 in 1999 to 30,000 in 2003. It is noteworthy
that at the beginning of the period, the number of applicants from Europe
doubled those of applicants from the Far East, but there was a dramatic change
in 2003. The figure of Far East Asians students was twice more than those of
European students.
It is also obvious that the number of
applicants from the Middle East slightly fluctuated during the period. The
figure increased from 10,000 in 1999 to 15,000 in 2001, but it fell to about
12,000 in 2002. In the next year, the figure again inclined to 20,000. Lastly,
the number of people who are from Africa was the same from 1999 to 2001, which
figure was approximately 2,500. However, the number of applicants was more than
5,000 in 2003.

 댓글 0개
댓글 0개


 불편사항 신고