


 인쇄
인쇄


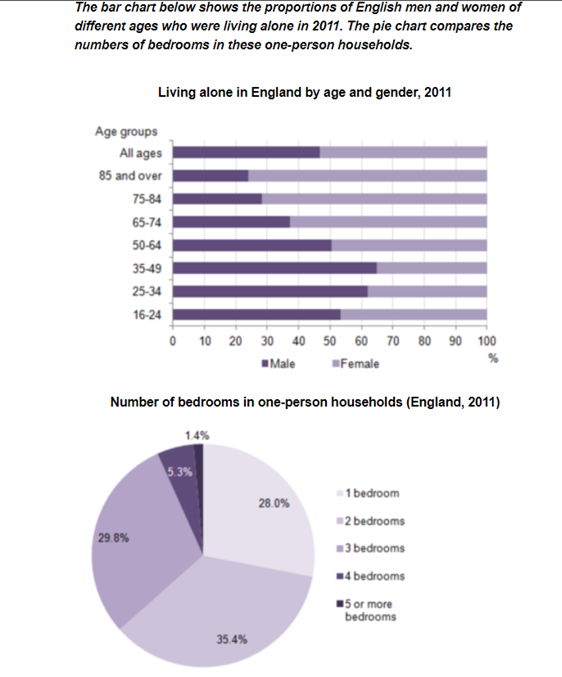
The bar chart and pie chart depict the record of those who lived alone in 2011 and bedrooms in one-person households. Overall, as people were getting older, female lived alone than male. Most of parts about bedrooms in one-person households occupied under 3.
As for the line graph, the number of all ages showed the similar trend, accounting for around 48% in male and roughly 52% in female. 16-24 years male continued single life, which was about 52%. The over 60% represented in the male group of 25-34 and 35-49 age. After aged 50 over, the male preferred to live alone decreased from 50% to about 24%. Meanwhile, the graph about female showed upward trend. Female aged 16-24 chose single life which constituted near 48%. Although the figure dropped in the group of 24-49 aged, the number climb from 50% in 50-64 age to about 78% in 85 and over.
In the pie chart, 2 bedrooms became the most popular, making up 35.4%. The percentage of 1 and 3 bedrooms nearly were equal as 28% and 29.8 % respectively. The marginal parts included 4 and 5 bedrooms.

 댓글 0개
댓글 0개


 불편사항 신고